
June was a difficult month for most stock and bond markets. And after 6 straight positive months, our Core portfolios had a negative month as well.
June 2017 Market Performance
All index returns are total return (includes reinvestment of dividends) and are in Canadian Dollars unless noted.
| Other Market Data | Month-end Value | Return for June 2017 | Return for 2017 |
|---|---|---|---|
| Oil Price (USD) | $46.04 | -4.72% | -14.30% |
| Gold Price (USD) | $1,242.30 | -2.33% | +7.87% |
| US 3 month T-bill | +1.03% | +0.05%* | +0.52%* |
| US 10 year Bond | +2.31% | +0.10%* | -0.14%* |
| USD/CAD FX rate | 1.2977 | -3.87% | -3.35% |
| EUR/CAD FX rate | 1.4813 | -2.31% | +4.55% |
| CBOE Volatility Index (VIX) | 11.18 | +7.40% | -20.37% |
*Absolute change in yield, not the return from holding the security.
The S&P/TSX Composite was down again in June at -0.8%, shrinking its year to date performance to +0.7%. In the US the S&P500 was up +0.6% (+9.3% YTD), while European stocks were down -1.0% (+5.7% YTD). German and British stocks were the laggards in June at -2.3% and -2.8%, respectively. Emerging market stocks were one of the bright spots in June at +1.2% , and are one of the best performers in 2017 at +13.7% YTD.
On the bond side, the broad index of Canadian bonds, FTSE TMX Universe Bond Index was down -1.2% for the month, reducing its YTD return to +2.4%. The FTSE TMX Short Term Bond Index was down -1.0% for the month, cutting its YTD return to just +0.3%. US bonds performed better, with higher rated credits performing the best. High yield bonds were flat, while emerging market bonds had their worst month since November 2016, finishing June down -4.0% cutting the YTD return to +2.8%.
Oil was down for the fourth month in a row at -4.7% and is now down -14.3% for 2017. Gold was also down in June at -2.3%, cutting its YTD return to +7.9%. The broad Bloomberg Commodity Index was also down for the fourth month in a row at -0.3%, bringing its YTD loss to -5.6%.
The Canadian dollar was one of the bright spots in June, gaining +3.9% against the US Dollar and +2.3% against the Euro.
Commentary
With US markets close to all time highs, we’ve had a few clients (particularly those that opened their accounts in the last month or so) wondering why their accounts are down. While we use the same ETFs in nearly all client accounts, performance for an individual investor or an individual account depends on when the ETFs were purchased, and in what proportion. But hopefully the following will help shed some light on how our portfolios have been doing.
So far 2017 has been strong for most asset classes, particularly US and emerging market stocks. As you can see from the graph of the ETFs we use below, most of that performance came in the first quarter, and many of the ETFs were negative in Q2. And if we look at June alone, pretty much all of the ETFs were negative, only VUS (US stocks, currency hedged) were positive.
Of course that is just the ETFs themselves, the other part of the story is how the ETFs are combined together. Looking at the returns of our performance composites shows a similar pattern: Q1 has been the strongest part of 2017 so far, Q2 was weaker, and the weakest month of the year was June.
With the negative performance from nearly all of the ETFs in June, all of our portfolios, both Core and SRI, were down for the month. On the Core side, all risk levels were down around -1%, while SRI portfolios were down between -1% and -2%.
On the surface, it seems strange having all the Core portfolios down about the same amount in a month. When global equity markets are down you would expect the higher risk levels to be down the most and the lowest risk levels to be down the least or even a little bit positive, since bonds usually perform well when stocks are having a down month. June was one of those infrequent cases where both stocks and bonds were down for the month.
With all of our Core portfolios coming off a six month streak of positive months, you might say we were due for a negative month.
Now that our Core portfolios now have 17 months of performance, a look at the positive and negative months is more representative than it would have been this time last year. Out of those 17 months, depending on the risk level, the portfolios were down in between 3 and 5 of those months, or about 20-30% of the time. So while 17 months is a small sample, being down in 20-30% of months is about what we would expect based on the simulations we ran when designing the portfolios. While no one likes to have their account down for a month (or longer) that is the price you pay when you are trying to capture the long-term returns from the global stock markets. And that is a price worth paying.
June Economic Indicator Recap
Below are the current readings on the major economic indicators: central bank interest rates, inflation, GDP and unemployment.
Below are the current readings on a few other often followed economic indicators: retail sales and housing market metrics.
A Closer Look at the Canadian Economy
Canada’s unemployment rate ticked up 0.1% to 6.6% in May, despite 77,000 new full time jobs being added. 22,300 part time jobs were lost. The rise in the unemployment rate was due to the rise in the labour force participation rate, which offset the effect of the new job creation.
Housing prices across Canada rose +2.2% in May, the largest gain on record for May. For the first time in 12 months, all 11 major metropolitan areas included in the index were positive. Toronto (+3.6%, an all time record month), Hamilton (+3.1%), and Victoria (+2.5%) showed gains greater than the national average.
After 5 months of new housing starts over 200,000, new housing starts declined to 195,000 in May, a drop of -8.9% from April. Building permits declined -0.2% in April.
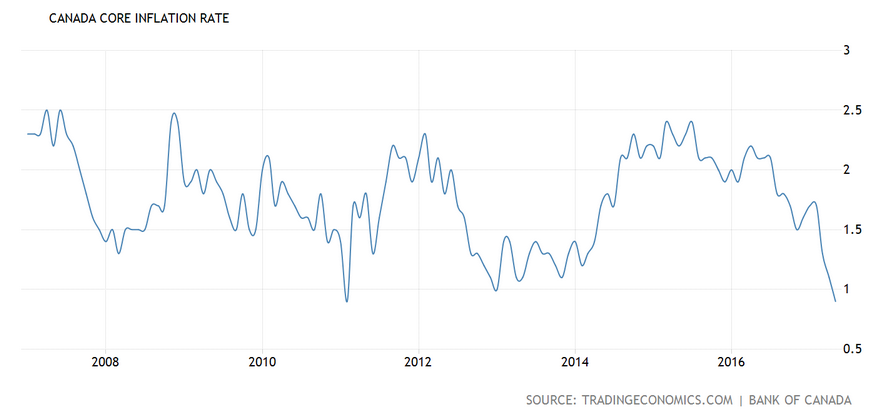
The inflation rate was +0.1% in May, or +1.3% on an annual basis. Core inflation which excludes more variable items such as gasoline, natural gas, fruit & vegetables and mortgage interest was +0.9% for the last year, the lowest level since 2011.
Retail sales rose +0.8% in April. The increase was attributed to higher sales at home improvement and clothing stores, which offset declines and new and used car dealers. Compared to a year ago, retail sales were up a healthy +7.0%.
Canada’s GDP rose +0.2% in April due entirely to growth in the service sector, as manufacturing was flat. The Bank of Canada Board of Governors met on July 12 and raised interest rates by 0.25% for the first time in 7 years. Within hours all of the major Canadian banks raised their prime lending rates by 0.25%. Don’t expect interest rates on savings accounts and GICs to go up any time soon though.
*Sources: MSCI, FTSE, Morningstar Direct, Trading Economics