
August was a negative month for almost everything; both equity and fixed income markets declined.
August 2022 Market Performance
All index returns are total return (includes reinvestment of dividends) and are in Canadian Dollars unless noted.
| Other Market Data | Month-end Value | Return for August 2022 | 2022 YTD Return |
|---|---|---|---|
| Oil Price (USD) | $89.55 | -8.57% | +19.07% |
| Gold Price (USD) | $1,726.20 | -2.95% | -5.60% |
| US 3 month T-bill | +2.96% | +0.55%* | +2.90%* |
| US 10 year Bond | +3.15% | +0.48%* | +1.63%* |
| USD/CAD FX rate | 1.3111 | +2.24% | +3.42% |
| EUR/CAD FX rate | 1.3161 | +0.68% | -8.55% |
| CBOE Volatility Index (VIX) | 25.87 | +21.28% | +50.23% |
*Absolute change in yield, not the return from holding the security.
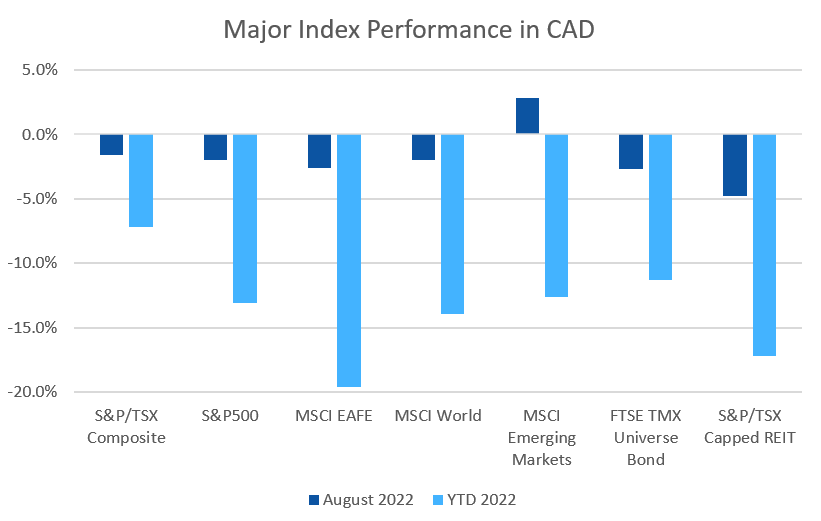
August was a negative month for almost everything, with both equity and fixed income markets declining.
The main index of Canadian stocks, the S&P/TSX Composite, was one of the better performers, declining only -1.6%. The S&P/TSX Small Cap was down -2.8%, as the decline in oil prices affected returns in small cap oil and gas companies. US markets were among the worst performers in August. The large cap S&P500 lost -4.1% (in USD), the index of US small cap stocks, the Russell 2000, did a little better losing -2.2%, and the tech focused Nasdaq lost -4.6% putting it at -24.5% for 2022.
The broad index of EAFE (Europe, Australasia & Far East) stocks lost -2.5% in August, bringing the YTD to -10.7%. Out of the EAFE regions, European stocks performed a little worse, losing -4.1% for the month. Meanwhile British stocks’ lost -1.9%, while Japanese stocks were one of the top performers at +1.0%. Emerging market stocks were also one of the few positives in August, gaining +0.8%.
Bond markets’ strength was short lived, with most bond indexes not following through on July’s gains.
The major Canadian bond index, the FTSE/TMX Universe Bond Index lost -2.7% in August, pushing the YTD loss back over -10%. The FTSE/TMX Short-term Bond Index lost -1.5% for the month, and is down -4.6% for 2022. In the US, investment grade bonds were negative and high yield bonds were mixed. The ICE BoA AAA index lost -4.0% for August, bringing the YTD loss to -15.6%. The BBB index lost -2.5% for the month. High yield bonds lost -2.4% in August for the HY Master II Index, while the CCC and lower (the real junky stuff) Index was positive at +0.3%.
Canadian REITs lost -4.8% in August, and are down -17.2% for 2022.
Oil retreated for the third month in a row, losing -8.6% in August and dropping below US$90 per barrel, but not providing much relief at the pumps. Gold lost -3.0% in August, and -5.6% for 2022 so far. The diversified Bloomberg Commodities Index lost -0.2% in August; its still the only index we track that is up more than +5% in 2022, gaining +21.8% so far this year.
In August the Canadian Dollar (CAD) lost ground against the US Dollar, declining -2.2%, and -0.7% against the Euro.
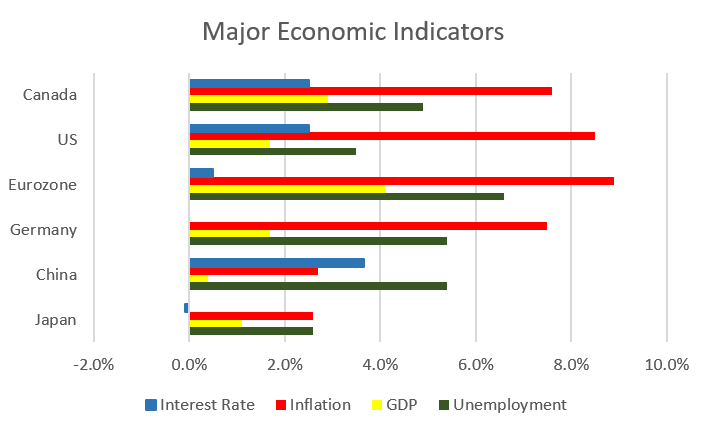
August 2022 Economic Indicator Recap
Below are the readings released in August for the major economic indicators: central bank interest rates, inflation, GDP and unemployment.
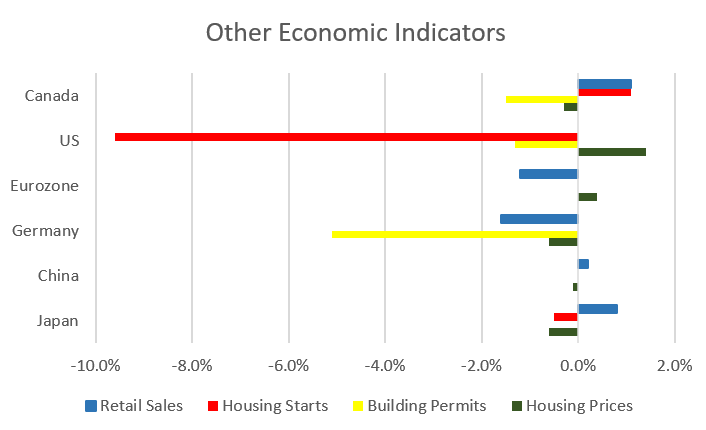
Below are the current readings on a few other often followed economic indicators: retail sales and housing market metrics.
A Closer Look at the Canadian Economy
Canada’s unemployment rate remained unchanged at 4.9% in July. The economy unexpectedly lost 30,600 jobs (17,500 part time and 13,100 full time), but since the labour force participation rate declined, the unemployment rate remained unchanged despite the job losses. This indicates that the economy is near full maximum employment.
Housing prices across Canada declined -0.3% in July, the first monthly decline since September 2019. 4 of 11 major markets posted declined: Toronto, Halifax, Hamilton, and Ottawa. The top gainers were Calgary (+2.3%), and Quebec City (+1.7%). The annual national price gain for the 12 months ended July 31 was +14.2%. Halifax was almost double that at +25.7%.
The level of new housing starts rose +1.1% to 275,300 units in July. Urban housing starts declined -0.8% to 254,400 as single-family construction declined -2.3%. The value of building permits issued declined -1.5% in June to $11.9 billion, led by a -10.4% decline in non-residential construction permits. The residential sector posted a +3.1% increase to $8.2 billion.
The inflation rate for July was +0.1%, and +7.6% on an annual basis, easing from the 39 year high seen last month. Transportation, food, and shelter (aka life!) were the primary drivers of inflation. Transportation costs surged +14.4% (driven by a 36% rise in gasoline prices). Food inflation was +9.2%, and shelter rose +7.0%. Core inflation which excludes more variable items such as gasoline, natural gas, fruit & vegetables and mortgage interest was +6.1%.
Retail sales were up +1.1% in June, with 8 of 11 sectors posting increases, led by higher sales at gas stations (again). Car sales were up +2.9%, clothing store sales rose +2.1%, and +1.3% at furniture stores. Compared to a year ago, retail sales were up +11.0%.
Canada’s GDP was up +0.1% in June, with both services and goods producing sectors posting gains. Accommodation and food services rose +0.8%, air transportation grew +5.6%, while finance and insurance shrank -0.6%.
The Bank of Canada’s next meeting is September 7, when the BoC is expected to raise interest rates again.
*Sources: MSCI, FTSE, Morningstar Direct, Trading Economics