
June was a difficult month for equity and fixed income investors alike.
June 2022 Market Performance
All index returns are total return (includes reinvestment of dividends) and are in Canadian Dollars unless noted.
| Other Market Data | Month-end Value | Return for June 2022 | 2022 YTD Return |
|---|---|---|---|
| Oil Price (USD) | $105.76 | -7.77% | +40.62% |
| Gold Price (USD) | $1,807.30 | -2.22% | -1.16% |
| US 3 month T-bill | +1.72% | +0.56%* | +1.66%* |
| US 10 year Bond | +2.98% | +0.13%* | +1.46%* |
| USD/CAD FX rate | 1.2886 | +1.88% | +1.64% |
| EUR/CAD FX rate | 1.3467 | -0.69% | -6.42% |
| CBOE Volatility Index (VIX) | 28.71 | +9.62% | +66.72% |
*Absolute change in yield, not the return from holding the security.
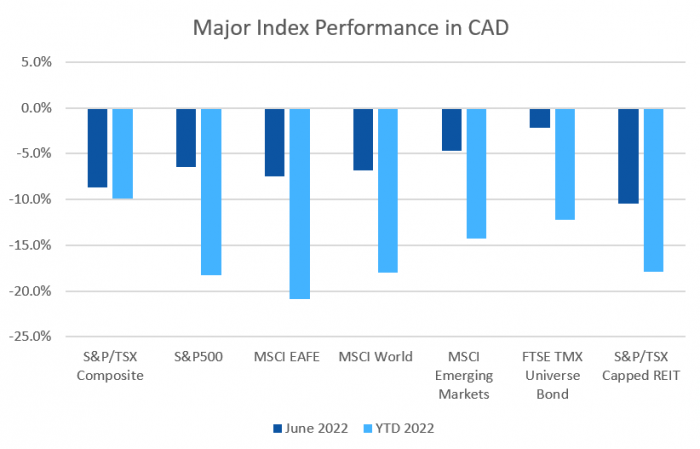
June was a difficult month for equity and fixed income investors alike.
The S&P/TSX Composite finished June down -8.7%, putting the YTD return at -9.9%. The S&P/TSX Small Cap was down -13.6%, bringing the YTD to -15.0% for 2022. US markets performed about the same; the large cap S&P500 lost -8.3% (in USD), and its now down -20.0% for 2022. The index of US small cap stocks, the Russell 2000, was down -8.4% for June (-23.9% for 2022), and the tech focused Nasdaq lost another -8.7% putting it at -29.5% for 2022, its worst year since the 2008 financial crisis.
The broad index of EAFE (Europe, Australasia & Far East) stocks was one of the better performers in June, losing-6.5% (-12.8% for 2022). Out of the EAFE regions, European stocks performed similarly, losing -7.8% for the month, meanwhile British stocks’ winning streak ended by losing -5.8% in June. Japanese stocks were down -4.8% in June (-9.8% for 2022). Emerging market stocks were down -5.1% for June and -14.9% for 2022.
Bond markets continue to struggle with the prospect of higher interest rates; most indexes we track posted their sixth negative month in a row, with many having their worst start to the year in decades.
The major Canadian bond index, the FTSE/TMX Universe Bond Index lost -2.2% in June, bringing the YTD loss to -12.2% – its worst drawdown since 1994! The FTSE/TMX Short-term Bond Index lost -0.8% for the month, and is down -4.4% for 2022. In the US, investment grade bonds and high yield bonds were both negative. The ICE BoA AAA index lost -1.9% for June, bringing the YTD loss to -15.2%. The BBB index lost -2.7% for June. High yield bonds lost -6.8% in June for the HY Master II Index, while the CCC and lower (the real junky stuff) Index lost -7.3%.
REITs were down -10.4% in June, and are down -17.9% for 2022.
Oil retreated in June, losing -7.7%; its still up +40.6% for 2022 though. Gold lost -2.2% in May. The diversified Bloomberg Commodities Index lost -10.9% in June, its still up +18.0% for 2022.
In June the Canadian Dollar (CAD) lost -1.9% against the US Dollar, and gained +0.7% against the Euro.
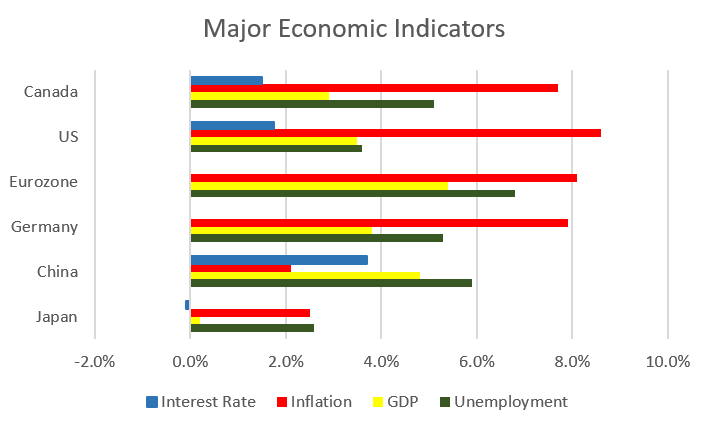
June 2022 Economic Indicator Recap
Below are the readings received in June for the major economic indicators: central bank interest rates, inflation, GDP and unemployment.
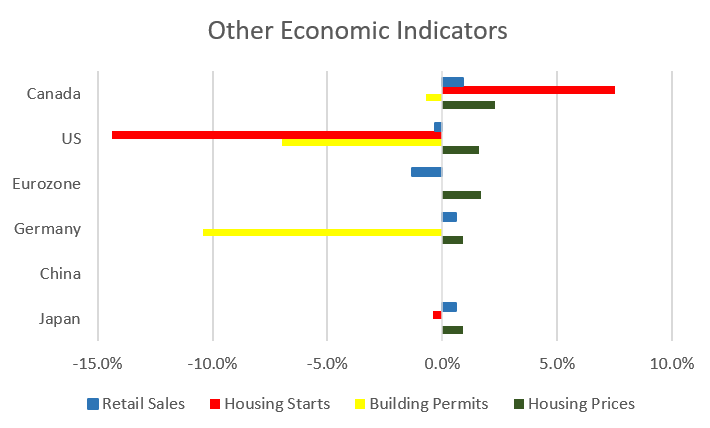
Below are the current readings on a few other often followed economic indicators: retail sales and housing market metrics.
A Closer Look at the Canadian Economy
Canada’s unemployment rate dropped to 5.1% in May, the lowest rate on record since comparable data became available in 1976. BC, New Brunswick, PEI and Newfoundland also had unemployment rates at or near record lows. The economy added 135,400 full time jobs, while 95,800 part time jobs were lost.
Housing prices across Canada were up +2.3% in May, with 10 of 11 major markets again posting gains. The top gainers were Halifax (+2.8%) and Montreal (+2.6%), while Edmonton was the only decliner, losing -1.5%. The annual national price gain for the 12 months ended May 31 was +18.3%. Halifax was almost double that at +34.0%, followed by Hamilton at +27.9% and Victoria at +23.0%. Nice to not see Vancouver near the top!
The level of new housing starts rose +7.5% to 287,250 units in May. Urban housing starts jumped +8% to 264,000 as multifamily (condo and townhouse) construction rose +13%. The value of building permits issued declined -0.6% in April to $11.7 billion, led by a -3.3% decline in residential construction. Non-residential construction grew +5.0%
The inflation rate for May was +1.4%, and +7.7% on an annual basis – the highest annual inflation rate since January 1983! Transportation, food, and shelter (aka life!) were the primary drivers of inflation. Transportation costs surged +14.6% (driven by a 48% rise in gasoline prices). Food inflation was again +8.8%; that’s nearly +20% over the last two months. Core inflation which excludes more variable items such as gasoline, natural gas, fruit & vegetables and mortgage interest was +6.1%.
Retail sales were up +0.9% in April, with 6 of 11 sectors posting increases. Unsurprisingly, sharp increases were seen in food prices. Car sales were down -0.8%. Compared to a year ago, retail sales were up +9.2%.
Canada’s GDP grew +0.3% in April with 13 of 20 sectors posting gains. The goods producing sectors grew +0.9%, with mining, quarrying, and oil and gas seeing a +3.3% gain. The services sectors grew +0.1%, with accommodation and food services the biggest gainer at +4.6%.
*Sources: MSCI, FTSE, Morningstar Direct, Trading Economics