September was a negative month for most equity and fixed income markets around the world. Not a huge surprise as September is, on average a down month, fortunately the fourth quarter is historically the best quarter of the year.
September 2021 Market Performance
All index returns are total return (includes reinvestment of dividends) and are in Canadian Dollars unless noted.
| Other Market Data | Month-end Value | Return for September 2021 | 2021 YTD Return |
|---|---|---|---|
| Oil Price (USD) | $75.27 | +9.88% | +55.13% |
| Gold Price (USD) | $1,753.55 | -3.55% | -7.47% |
| US 3 month T-bill | +0.04% | 0.00%* | -0.05%* |
| US 10 year Bond | +1.52% | +0.22%* | +0.59%* |
| USD/CAD FX rate | 1.2741 | +0.98% | +0.07% |
| EUR/CAD FX rate | 1.4801 | -0.70% | -5.17% |
| CBOE Volatility Index (VIX) | 23.14 | +9.88% | +1.71% |
*Absolute change in yield, not the return from holding the security.
September was a negative month for most equity and fixed income markets around the world. Not a huge surprise as September is on average a down month, fortunately the fourth quarter is historically the best quarter of the year.
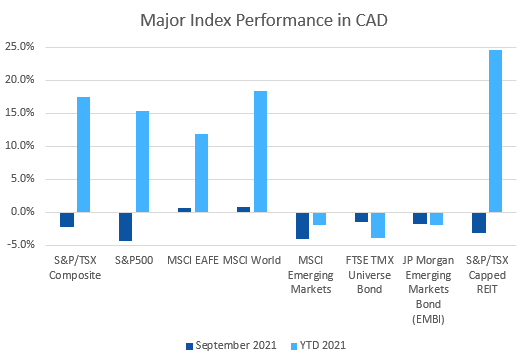
The S&P/TSX Composite was down -2.2% in September, bringing the return for 2021 down to +17.5%. The S&P/TSX Small Cap performed a little better, and only declined -0.3% for the month. In the US, the large cap S&P500 was harder hit, losing -4.7% (it’s still up almost +16% for the year). The index of US small cap stocks, the Russell 2000, was down -3.1% for September. The tech focused Nasdaq was also hit hard, losing -5.3% in September, which cut the year to date return to +12.1%.
The broad index of EAFE (Europe, Australasia & Far East) stocks was one of the better performers, declining less than -2% in September, while European stocks specifically declined -3.1%. Both are still up more than +12% for 2021. Japanese stocks were the top performers in September, gaining +4.9%, but for 2021 they are one of the worst performers up only +7.3%. Emerging market stocks were down -3.1%, and have now swung negative for 2021 at -1.0%.
Bonds were down in September. The major Canadian bond index, the FTSE/TMX Universe Bond Index, lost -1.4% during the month while the FTSE/TMX Short-term Bond Index was down -0.4%. Both are negative for 2021; -4.0% for the Universe index and -0.4% for the Short-term index. US investment grade bonds also declined; the ICE BoA AAA lost -1.7% and the BBB lost -1.0%. High yield was flat for HY Master II and +0.7% for the CCC and lower (the real junky stuff) Index. Emerging market bonds were down -1.8%, bringing the YTD loss to -1.9%.
The strong run for REITs finally ended, as they lost -3.1% in September. Despite that REITs are still up almost +25% for 2021.
Oil gained +9.9% in September, breaking through the US$75 a barrel level for the first time since the fall of 2014. Gold, often considered a save haven, lost -3.6% for September, and is down -7.5% for 2021. The diversified Bloomberg Commodities Index gained +5.0%, and is up +29.1% for 2021.
In September, the Canadian Dollar (CAD) lost -1.0% against the US Dollar, bringing it back to where it started the year. Against the Euro, CAD gained +0.7% for the month.
September 2021 Economic Indicator Recap
Below are the readings received in September for the major economic indicators: central bank interest rates, inflation, GDP and unemployment.
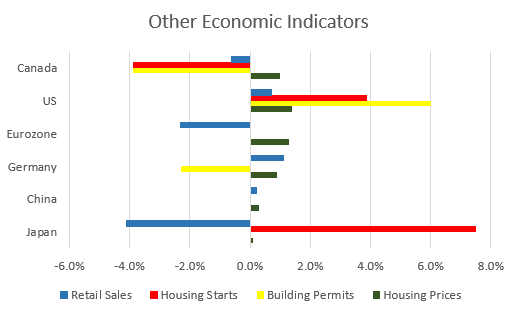
Below are the current readings on a few other often followed economic indicators: retail sales and housing market metrics.
A Closer Look at the Canadian Economy
Canada’s unemployment rate dropped to 7.1% in August, the lowest rate since the COVID-19 pandemic began in early 2020, as most regions implemented reopening plans. The economy gained 90,200 jobs, 68,500 of which were full-time jobs and 21,700 were part-time jobs. Combined with gains seen in June and July, total employment is now only 156,000 jobs away from February 2020 levels.
Housing prices across Canada continued to slow in August, gaining +1.0% vs after several months of gains in excess of +2.0%. Gains were led by again by Ottawa (+2.1%), followed by Montreal (+2.1%), and Hamilton (+1.7%). For the sixth consecutive month all 11 major housing markets were positive.
The level of new housing starts declined -3.9% to 260,200 in August, the third straight month of declines. Urban housing starts declined -4.7%, due to a decline of -5.7% in multi family urban home construction. One of the main trends in housing during the pandemic as touted in the media, was urbanites leaving places like the GTA (Greater Toronto Area) and moving to much less expensive parts of Canada like the Maritimes. It seems that housing construction is starting to reflect that. Building permits issued declined -3.9% in July to $9.9 billion, with seven provinces contributing to the loss. Alberta was the largest decliner at -24.3%, while Ontario declined -10.5%. Alberta also led the declines in the non-residential sector with a decline of -46.9% (!). Canada wide, non-residential construction declined -5.6%
The inflation rate for August was +0.2%, and +4.1% on an annual basis – the highest annual inflation rate since March 2003. Part of the reason for the higher level of inflation is the lower price levels seen in the midst of the worst of the pandemic in summer 2020. Most of the increase was attributed to rising gasoline prices. Core inflation which excludes more variable items such as gasoline, natural gas, fruit & vegetables and mortgage interest was +3.5%.
Retail sales were down -0.6% in July, and +5.3% compared to a year ago. Most of the downward pressure came from lower sales at grocery stores as well as building and garden centres. Clothing stores led the gainers, up +7.6%.
Canada’s GDP was down -0.1% in July. The largest declines were reported in agriculture (-5.5%), utilities (-3.6%) and wholesaling (-1.9%). On the other hand, accommodation and food services gained +8.1%.
As expected, the Bank of Canada left its benchmark interest rate at 0.25% at the September 8th meeting. The benchmark interest rate is expected to remain at its current low level until into second half of 2022. The BoC maintained its quantitative easing program of purchasing government and corporate bonds at $2 billion per week.
*Sources: MSCI, FTSE, Morningstar Direct, Trading Economics


