
Stock markets were generally positive in March, as were Canadian bonds. Why a 100% equity portfolio might be a bad idea.
March 2017 Market Performance
All index returns are total return (includes reinvestment of dividends) and are in Canadian Dollars unless noted.
| Other Market Data | Month-end Value | Return for March 2017 | Return for 2017 |
|---|---|---|---|
| Oil Price (USD) | $50.60 | -6.31% | -5.81% |
| Gold Price (USD) | $1,247.30 | -0.53% | +8.30% |
| US 3 month T-bill | +0.76% | +0.23%* | +0.25%* |
| US 10 year Bond | +2.40% | +0.04%* | -0.05%* |
| USD/CAD FX rate | 1.3310 | +0.22% | -0.87% |
| EUR/CAD FX rate | 1.4222 | +1.07% | +0.37% |
| CBOE Volatility Index (VIX) | 12.37 | -4.26% | -11.89% |
*Absolute change in yield, not the return from holding the security.
The S&P/TSX Composite was up +1.3% in March, its fourteenth positive month in a row. The S&P500 was essentially flat for the month at +0.1%. European stocks performed particularly well: the MSCI Europe Index was up +3.1%, driven primarily by German stocks, which were up +4.0%. Emerging market stocks were up +1.8%.
On the bond side, the broad FTSE TMX Universe Bond Index was up +0.4% in March, while the short-term bond index was up +0.1%. US bonds sold off slightly in March and were down between -0.4% and -0.1%. The high yield bond indexes were mixed, while emerging market bonds were up +1.1%.
Oil had a difficult month, down -6.3%, and gold was down -0.5%. The broad Bloomberg Commodity Index was down -2.7%.
The Canadian dollar slipped against both the US Dollar and the Euro, -0.2% and -1.1%, respectively.
Commentary
We’ve had a few clients lately point out that even at our highest risk level, there is still some fixed income in the portfolio, it is not 100% equities. With stock markets in North America near all time highs and volatility near historic lows, it is not that surprising that some clients are looking for a very aggressive portfolio. In many cases, these investors were not investing in the stock markets in 2007-2009 or 2000-2002 so they would not have experienced the steep and prolonged losses and very high day-to-day volatility.
It has been over a year since the S&P/TSX composite experienced a down day greater than -2% and almost 2 years since we’ve had a 30 day period with more than one -2% day. Below is the realized volatility of the S&P/TSX Composite over the last 12 months and another over the last 24 months.
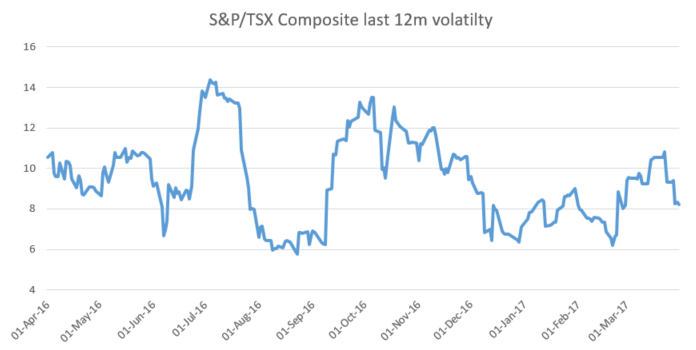
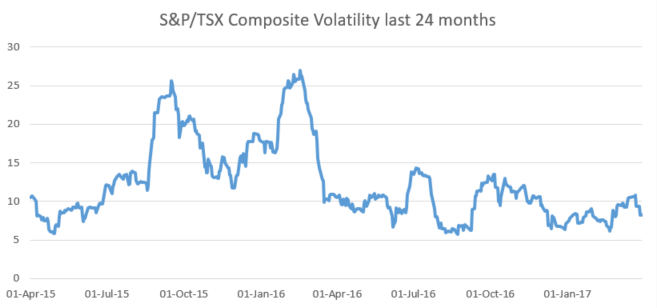
The last 12 months haven’t been very volatile; a reading under 20 is considered low while readings under 10 were pretty much unheard of until just a few years ago. Even if we look back 5 years, the stock market has only been moderately volatile in a few relatively short periods.
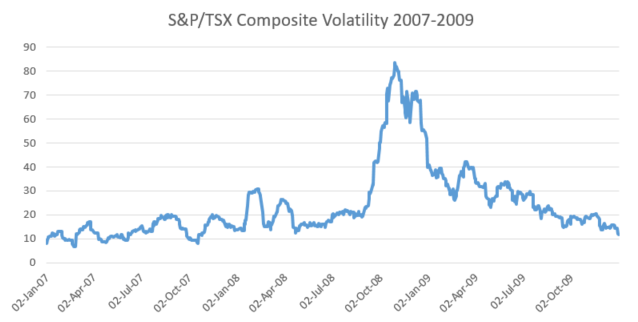
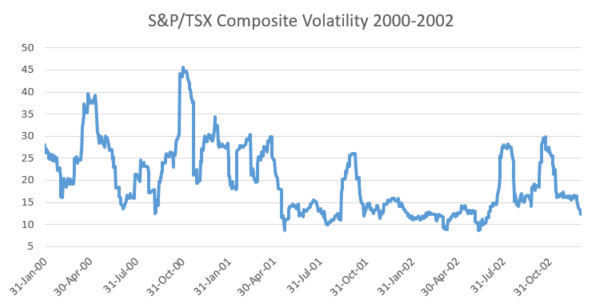
To find really volatile periods we need to look back to 2007-2009 and 2000-2002
Volatility can be an abstract concept for many people, so let’s take a look at the actual returns.
If you had invested $1,000 in the S&P/TSX Composite Index on January 1, 2007 you would have had $1,098 by the end of the year. The markets gave back some of those gains early in 2008, but picked up in the summer. Mid way through 2008 you would have been up to $1,180. But then the financial crisis hit. By the end of 2008 your $1,000 investment would have declined to $736. Unfortunately, the financial crisis isn’t an exception.
If you had invested $1,000 in the TSX on January 1, 2000, your investment would have been worth $1,346 at the end of August, but shrunk to $1,074 by the end of the year. By the end of 2001 your $1,000 investment would have been worth $939, by the end of 2002 only $822.
If those kind of losses make you think twice about a 100% equity portfolio, good. So what can we do to smooth it out? Add fixed income.
Instead of investing $1,000 in just the S&P/TSX Composite Index, if you instead invested $600 there and $400 in the FTSE/TMX Universe Bond Index on January 1, 2007, you would have had $1,073 by the end of the year. Midway through 2008 you would have been at $1,132. Those numbers are all lower than with the 100% TSX portfolio, but the payoff came later in the year. By the end of 2008 your $1,000 investment would have declined to $883. Not great, but $147 better than the 100% TSX portfolio. Fortunately, the financial crisis isn’t an exception (no that’s not a typo).
Instead of investing $1,000 in the TSX on January 1, 2000, if you instead invested $600 there and $400 in the FTSE/TMX Universe Bond Index your investment would have been worth $1,235 at the end of August, but shrunk to $1,085 by the end of the year. That’s $9 better than the 100% TSX portfolio. By the end of 2001 your $1,000 investment would have been worth $1,040, by the end of 2002 only $1012. That’s $101 and $190 better, respectively, than the 100% TSX portfolio.
Adding fixed income to a portfolio smooths out an investor’s experience when investing in the stock market. You give up some of the potential gains over a 100% stock portfolio when stock markets are doing very well, but you make up for that in poor markets. Clients in lower volatility portfolios are more likely to stick with their investment plans than those in 100% equity portfolios and are less likely to want to sell at just the wrong time.
March Economic Indicator Recap
Below are the current readings on the major economic indicators: central bank interest rates, inflation, GDP and unemployment.
Below are the current readings on a few other often followed economic indicators: retail sales and housing market metrics.
A Closer Look at the Canadian Economy
Canada’s unemployment rate declined to 6.6% in February as 105,100 full time jobs were added but 89,800 part time jobs were lost. The last time over 100,000 full time jobs were added in a month was 2011.
Housing prices across Canada rose 1.0% in February. Toronto (+1.9%), Hamilton (+1.4%), Vancouver (+1.4%), and Ottawa (+0.9%) provided the gains while the other 7 major cities all declined for the month. Winnipeg was down for the 4th month in a row.
The number of new housing starts rose +2.3% in February, while building permit activity in January rose +5.4%.
The inflation rate was +0.2% in February, or +2.0% on an annual basis. Core inflation which excludes more variable items such as gasoline, natural gas, fruit & vegetables and mortgage interest was +1.7% for the last year. Retail sales were up +2.2% in February, the largest increase since March 2010. The growth was attributed to a surge in car sales, namely new cars. Compared to a year ago, retail sales were up +4.5%.
GDP was up +0.6% in January, the largest monthly gain since June 2016. The increase was attributed mainly to manufacturing, mining and oil & gas, and retail sales. The Bank of Canada left the benchmark interest rate unchanged at their March 1st meeting. The next meeting is scheduled for April 12th.
*Sources: MSCI, FTSE, Morningstar Direct, Trading Economics