
Stock markets were positive in February, and Canadian and US stocks continued to hit new all time highs. Should you change your investment style with markets all time highs?
February 2017 Market Performance
All index returns are total return (includes reinvestment of dividends) and are in Canadian Dollars unless noted.
| Other Market Data | Month-end Value | Return for February 2017 | Return for 2017 |
|---|---|---|---|
| Oil Price (USD) | $54.01 | +2.27% | +0.54% |
| Gold Price (USD) | $1,253.90 | +3.75% | +8.87% |
| US 3 month T-bill | +0.53% | +0.01%* | +0.02%* |
| US 10 year Bond | +2.36% | -0.09%* | -0.09%* |
| USD/CAD FX rate | 1.3281 | +2.07% | -1.09% |
| EUR/CAD FX rate | 1.4071 | +0.16% | -0.69% |
| CBOE Volatility Index (VIX) | 12.92 | +7.76% | -7.98% |
*Absolute change in yield, not the return from holding the security.
February was generally a positive month, especially for US and international stocks.
The S&P/TSX Composite was up +0.1% in January, its thirteenth positive month in a row. The S&P/TSX 60 (a large cap subset of the S&P/TSX Composite) and S&P/TSX Composite both hit new all time highs in February. The S&P500 was up +3.7% and also hit several new all time highs in February. British stocks were up +2.3%, while German stocks were up +2.6%. Emerging markets were also positive at +1.6%.
On the bond side, the broad FTSE TMX Universe Bond Index was up +1.0% in February, while the short-term bond index was up +0.3%. US bonds also performed well, with indexes of lower quality bonds again performing the best. The high yield bond indexes were positive across the board, while emerging market bonds were one of the top performers at +3.6%.
Oil was up +2.3% in February, while gold was up +3.7% largely due to the continued decline in the US Dollar. The broad Bloomberg Commodity Index was slightly positive at +0.2%.
Surprisingly, the Canadian dollar continues to gain against the US dollar, and was up 2.1% in February. Against the Euro, the Canadian dollar gained +0.2%.
Commentary
We’ve been getting a lot of questions lately about what to do now that markets are at all time highs. Our answer is, it depends on which markets you mean.
Yes, the S&P/TSX Composite in Canada, and the S&P500 and Dow Jones Industrial Average in the US have hit all time highs repeatedly over the last few months, but does that mean you should do something different with your investments?
Generally, no.
If you already have a diversified portfolio that you add to regularly, then you should just keep doing what you’re doing. When you add new money to your account you should be adding to the positions that are furthest below their target weights. Depending on how everything else is doing in your portfolio, it could mean that you don’t need to add to Canadian or US stocks.
The other thing to consider is how much of your portfolio’s asset allocation is dedicated to Canadian and US stocks. If you have a home bias like many Canadian (and US) investors, then you should consider changing your asset allocation so that you are more diversified geographically.
If you look at our standard core portfolios, at the low end, our Risk Level 1 portfolio contains only 6.9% in Canadian and US stocks. At the high end, our Risk Level 10 portfolio contains 30.6% Canadian and US stocks. So even at the highest risk level, less than a third of your portfolio would be going into asset classes that are at all time highs.
Consider Valuation
If you are buying Canadian or US stocks, you may be paying all time high prices, but the other thing to consider is what is the value of those assets?
There are many ways you can look at the value of an investment, one of the most commonly used is Price to Earnings, or P/E. P/E is commonly calculated using the last 12 months of earnings so it can be a little volatile, or meaningless if a company has losses. Robert Shiller, a finance professor at Yale University, created a version of the P/E that uses 10 year data called Shiller P/E.
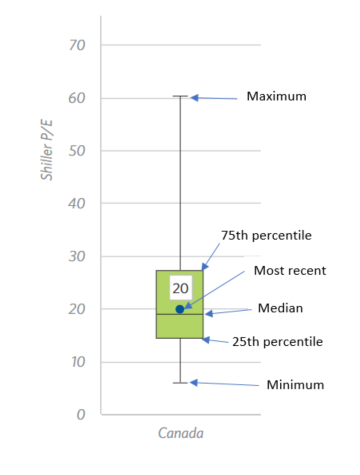
We took a look at the Shiller P/E for Canada, the US and a few other markets. If you’re not familiar with box and whisker plots here’s how to interpret them.
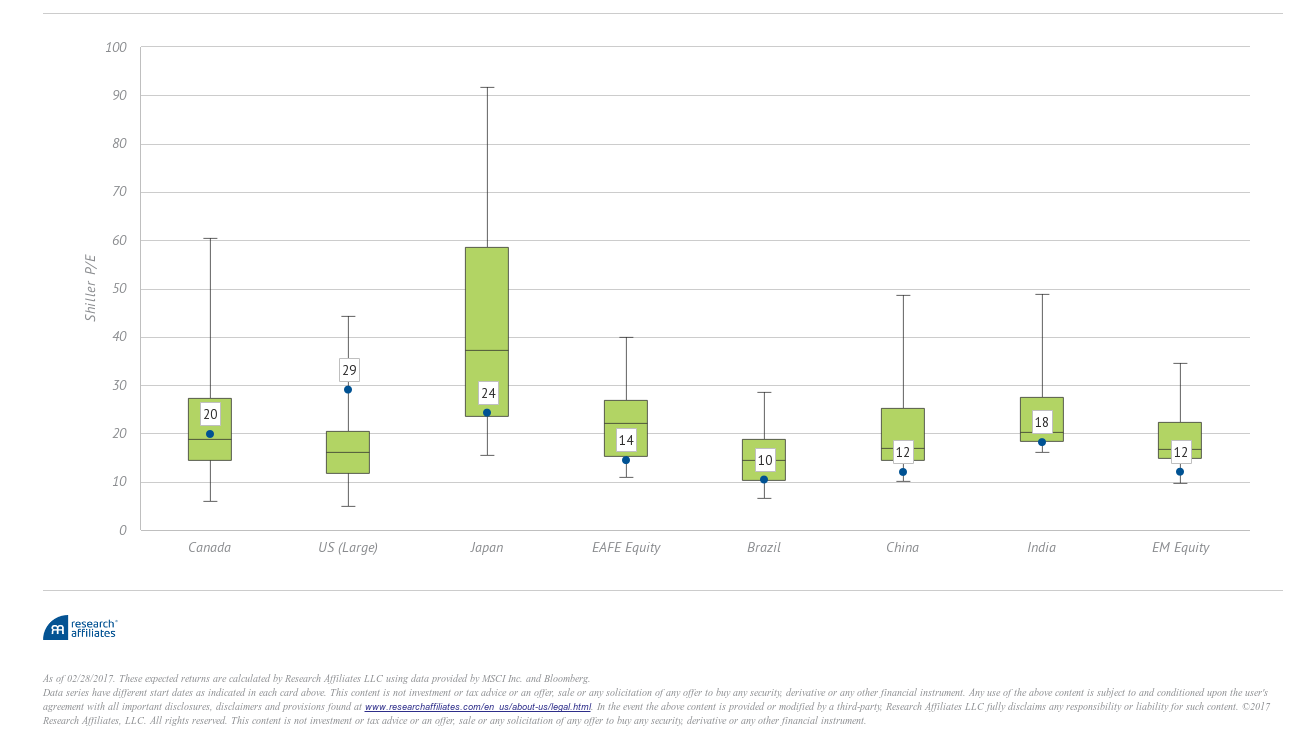
The US S&P500 (US large in the above) is currently at 29, way above the median and is probably in the top 10% of the readings for the US since 1871. Canada meanwhile is pretty much on the median (meaning 50% of the readings are above and 50% are below).
When we looked at countries and regions outside the US and Canada, we found that most of them are historically inexpensive. EAFE (Europe, Australia, and Far East) are in the cheapest 25% of where it’s been historically, as are the emerging markets (EM Equity above).
While the US markets are at all-time highs, and are historically expensive from a valuation standpoint, if you have a well diversified portfolio you should have little to worry about.
February Economic Indicator Recap
Below are the current readings on the major economic indicators: central bank interest rates, inflation, GDP and unemployment.
Below are the current readings on a few other often followed economic indicators: retail sales and housing market metrics.
A Closer Look at the Canadian Economy
Canada’s unemployment rate ticked down to 6.8% in January as 15,800 full time and 32,400 part time jobs were added.
Housing prices across Canada rose 0.5% in January. Hamilton (+1.1%), Toronto (+0.8%), and Montreal (+0.8%) all posted monthly gains that were above the national average. Vancouver ended its streak of three negative months with a +0.3% gain in January.
The number of new housing starts rose 0.9% in January, while building permit activity in December shrunk -6.6%.
The inflation rate was +0.9% in January, or +2.1% on an annual basis. Core inflation which excludes more variable items such as gasoline, natural gas, fruit & vegetables and mortgage interest was +1.7% for the last year. Retail sales were down -0.5% in January, the first decline in five months. The decline was attributed to a -0.9% decline in auto sales. Compared to a year ago, retail sales were up +4.3%.
GDP was up +0.3% in December, topping off the fourth quarter at +0.6%. The increase was attributed mainly to growth in utilities, electricity generation, and natural gas distribution. The Bank of Canada left the benchmark interest rate unchanged at their March 1st meeting. The next meeting is scheduled for April 12th.
*Sources: MSCI, FTSE, Morningstar Direct, Trading Economics