
August was a relatively good month for stock and bond markets around the world.
August 2017 Market Performance
All index returns are total return (includes reinvestment of dividends) and are in Canadian Dollars unless noted.
| Other Market Data | Month-end Value | Return for August 2017 | Return for 2017 |
|---|---|---|---|
| Oil Price (USD) | $47.23 | -5.86% | -12.08% |
| Gold Price (USD) | $1,322.20 | +4.39% | +14.80% |
| US 3 month T-bill | +1.01% | -0.06%* | +0.50%* |
| US 10 year Bond | +2.12% | -0.18%* | -0.33%* |
| USD/CAD FX rate | 1.2536 | +0.41% | -6.64% |
| EUR/CAD FX rate | 1.4887 | +1.14% | +5.07% |
| CBOE Volatility Index (VIX) | 10.59 | +3.22% | -24.57% |
*Absolute change in yield, not the return from holding the security.
The S&P/TSX Composite was up +0.7% in August, and is up +1.3% so far in 2017. In the US, the S&P500 was up +0.3%, its 10th consecutive positive month. European stocks were down slightly in August at -0.2%, driven primarily by negative performance from German stocks. Emerging markets were again one of the top performers, posting their 8th positive month in a row and are now up +20.9% for 2017.
On the bond side, the broad index of Canadian bonds, FTSE TMX Universe Bond Index was up +1.4% in August. The FTSE TMX Short Term Bond Index was also up for the month at +0.4%. US bonds were also positive, however this month saw higher rated credits performing best. High yield bonds were flat in the US and up +0.6% in Canada, while emerging market bonds were up +2.0% for the month.
Oil was down -5.9% for August, while gold was up +4.4%. The broad Bloomberg Commodity Index was up +0.3% for the month.
The Canadian dollar took a breather in August and lost -0.4% against the US Dollar and -1.1% against the Euro.
Commentary
The modern world has become more and more focused on the short term in the last 10 or 20 years, and it seems that this has only accelerated since the introduction of smartphones (maybe not the first blackberry, but certainly with the iPhone). The investment industry has not been spared by this and has often fed into this short term focus when it helps their profit margins (consider any of the trading apps). It has become easier and easier to make changes to your investments when you can view them and trade them on your smartphone. But what most don’t realize is there is a return-eating cost each time you make a trade, both in terms of transaction fees and the bid/ask spread, not to mention the tendency to buy high and sell low.
This short term focus has carried into performance. Before the widespread use of the internet, you couldn’t look up information on a company and its stock with out making a phone call or receiving a fax. Most companies sent out their annual reports by mail, and in most cases you only received updates on your account’s performance on a monthly or quarterly basis when you received your account statements in the mail. Now you can check on your investments in seconds and set alerts to notify you of news, earnings reports, and other things that might affect your investments. Investing for the long term used to mean a time frame measured in decades, not months. Not allowing compounding to work its magic over time means that you don’t capture the long term growth that most investments have due to poor timing when buying and selling and trading costs. In many cases the key to superior returns is ability to tune out the short term ups and downs, Warren Buffet and Berkshire Hathaway is a prime example.
Warren Buffett is often held up as the best investor in history. His track record at Berkshire Hathaway is legendary:
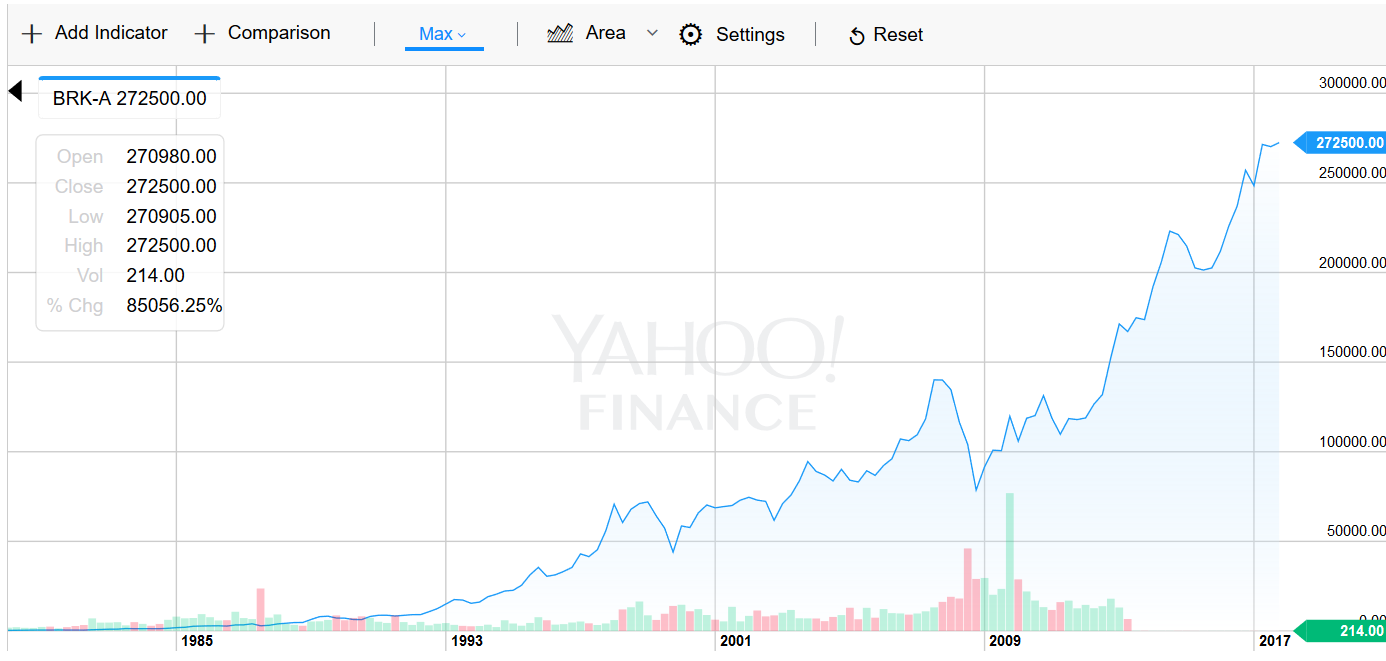
Yahoo! Finance only allows you to go back to 1980, but even over that time frame Berkshire (BRK) had an annualized return of 20%! A return like that over 35+ years is almost unheard of. But as you can see it was not a smooth ride. The share price of BRK peaked at $72,000 in March 1999, but then dropped to $44,000 in December 1999, a decline of -39%. Two years later that decline was recovered. The next major decline (-18%) occurred in 2002; within 6 months it was at a new all-time high again. In September 2007, BRK hit a high of $140,000, but halved during the financial crisis. Yes, even arguably the best investor of all time saw his investments halve in 2008! Today BRK is at $272,000.
While it is possible to earn high returns on your investments over the long term, but you have to be able to stomach the occasional large declines in the short term that even on the bluest of blue chips will exceed the long term annualized return. The important thing to take away from this is that even the best investments experience large declines in value, but ultimately recover and continue on to hit new highs. Tune out the short term news and headlines and focus on the long term.
August Economic Indicator Recap
Below are the current readings on the major economic indicators: central bank interest rates, inflation, GDP and unemployment.
Below are the current readings on a few other often followed economic indicators: retail sales and housing market metrics.
A Closer Look at the Canadian Economy
Canada’s unemployment rate ticked down 0.2% to 6.3% in July, as a net 10,900 new jobs were added; 35,100 of those were full time jobs which were partially offset but the 24,300 part time jobs lost.
Housing prices across Canada rose +2.0% in July. The top performing markets were: Victoria and Vancouver both at +2.8%, Hamilton and Toronto both at +2.1%, Ottawa at +2.0% and Montreal at +1.6% Halifax was the only market down for the month at -1.1%. New housing starts rose +4.4% in July, while building permits rose +2.5% in June.
The inflation rate was flat in July, but +1.2% when measured on an annual basis. Core inflation which excludes more variable items such as gasoline, natural gas, fruit & vegetables, and mortgage interest has been stuck at +0.9% for the last 3 months, the lowest level since the 1980s.
Retail sales were basically flat at +0.1% in June. A decline in sales at car dealers and gas stations offset gains at clothing and general merchandisers. Compared to a year ago, retail sales were up a healthy +7.3%.
Canada’s GDP rose +0.3% in June, the eighth consecutive month of growth. The growth was attributed to gains in construction, manufacturing, and the retail sector. For the second quarter, GDP grew +1.1%, or +4.5% annualized – the highest growth rate since 2011.
While the weak inflation data suggested that the Bank of Canada would leave its benchmark interest rate unchanged at their September 6 meeting, the recent strong economic growth and retail sales outweighed inflation concerns and in a surprise to many, the BoC hiked interest rates +0.25% to +1.0%.
*Sources: MSCI, FTSE, Morningstar Direct, Trading Economics