
Stock markets took a breather in May, as did the Canadian Dollar, while real estate in Canada’s major cities did not. Oil continued to rise, briefly hitting US $50 per barrel.
May 2016 Market Performance
All index returns are total return (includes reinvestment of dividends) and are in Canadian Dollars unless noted.
| Other Market Data | Month-end Value | Return for May |
Return for 2016 |
| Oil Price (USD) | $49.10 | +6.93% | +28.87% |
| Gold Price (USD) | $1,217.50 | -5.66% | +14.84% |
| US 3 month T-bill | +0.34% | +0.12% | +0.18% |
| US 10 year Bond | +1.84% | +0.01% | -0.43% |
| USD/CAD FX rate | 1.3110 | +4.48% | -5.27% |
| EUR/CAD FX rate | 1.4586 | +1.52% | -2.95% |
| CBOE Volatility Index (VIX) | 14.19 | -9.62% | -22.08% |
*Absolute change in yield, not the return from holding the security.
Stock markets took a bit of breather in May, posting smaller gains and losses than in previous months. The S&P/TSX Composite Index was up +0.8% for the month and is up +8.1% for the year. This is way ahead of how most of the stock markets around the world have performed so far 2016. European markets are down around -5% on average. Japan’s was up +3.4% in May, but is still down -9.5% for 2016. With the calm markets, its no surprise the volatility has been very low, both on the implied (VIX) measure and realized measure.
Canadian bonds had a good month, in both the government and corporate markets. Government bond indexes were all up around +1%, while corporate bond indexes were up +0.5% to 1.0%. High yield bonds performed very well: the Merrill Lynch Canadian HY Index was up +4.6%. US bond markets were also positive but to a lesser degree compared to Canada. Emerging market bonds, as measured by the JP Morgan EMBI were up +4.2%, snapping a 3 month losing streak and recovering much of the -5.8% drawdown.
Oil continued its rise, briefly crested US $50 per barrel, before settling back to $49. For the year oil is up 28.9% and up 66% from its low in January. Gold declined -5.7% in May. Other precious metals such as silver and platinum were also down. The broad Bloomberg Commodity Index was down -0.2%, but remains up +8.6% for 2016.
After a few months of strong gains, the Canadian Dollar reversed course and finished lower against the US Dollar and Euro, finishing at 1.3110 and 1.4586, respectively.
Commentary
Real estate is a hot topic in Canada these days and has been for a while in our largest cities like Vancouver and Toronto. Outside of these cities prices and price gains in percentage terms have not been out of reach for most Canadians. The headline grabbing prices for detached homes on Vancouver’s westside and the city of West Vancouver have been out of reach for most Canadians for over a decade or longer. The suburbs have long been the place for young families looking to buy a home with a big backyard, but in Greater Vancouver the prices there are starting to get out of reach as the higher end buyers in Vancouver proper have been pushed to the suburbs as well.
We looked at the real estate data for the 11 largest cities in Canada over the last decade from Teranet National Bank. The interesting thing was that over the last 10 years, only Vancouver, Winnipeg and Toronto were able to beat both Canadian stocks and bonds the S&P/TSX Composite and the FTSE/TMX Universe Bond Index. If you bought property 10 years ago in Victoria, Calgary, Ottawa, Montreal or Halifax, you would likely have been better off buying an index ETF like XIC than buying real estate. Of course those Teranet National Bank indexes are a snapshot of the whole region, so there are parts of the cities that would have done even better and some that would have done worse than the index as it is an average of price gains in those cities.
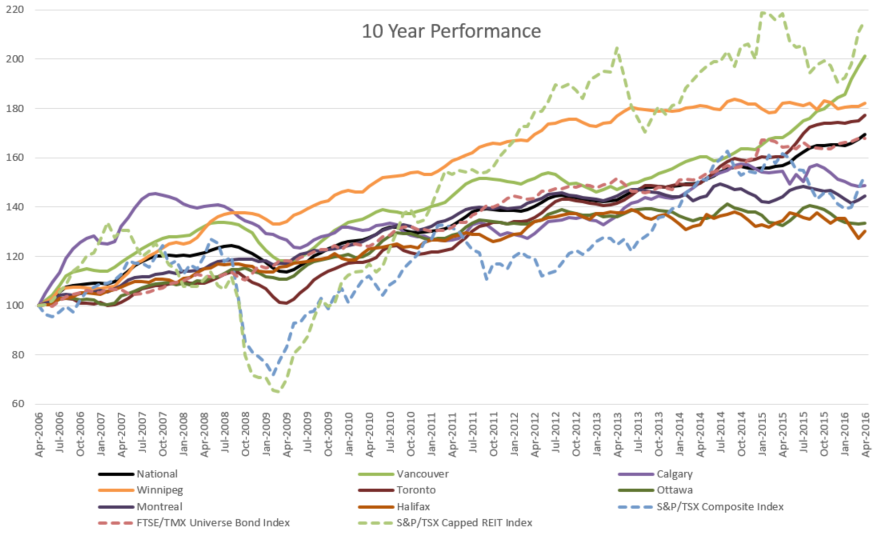
What is even more interesting is that the S&P/TSX Capped REIT Index even beat Vancouver real estate over the last 10 years (+8.0% vs. +7.3% annualized). That is an index of real estate investment trusts (REITs) that trade on the Toronto stock exchange. Those REITs hold mostly commercial real estate like office buildings, shopping malls, and industrial buildings.
Keep in mind those real estate indexes only include the price gain, they don’t include the cost of mortgage interest, property tax, land transfer tax or realtor fees. Real estate indexes are by nature, not a great picture of house prices since not all homes in the city are providing the prices; it depends entirely on home sales. Whereas, a stock market index includes the current prices of all stocks that make up that index, since they all trade on a daily basis.
The various levels of government have been discussing various ways to slow price increases. Previous changes to mortgage downpayment rules rules only applied to homes in the $500,000 to $1 million and only if you were putting less than 20% down. Foreign ownership comes up a lot in the debate over what to do about housing prices. Right now Canada is one of the few developed countries that does not have any rules on foreign ownership. Australia limits foreigners to only buying newly built homes and any bare land purchased has to be built on within 2 years. The UK imposed a capital gains tax on foreign owned real estate. Switzerland has quotas on foreign ownership. Mexico does not allow foreign ownership in restricted areas (basically along the coasts and borders). Of course there are always ways to get around the rules, but having rules in place would be good start to help keep home prices affordable.
May Economic Indicator Recap
Below are the current readings on the major economic indicators: central bank interest rates, inflation, GDP and unemployment.
Below are the current readings on a few other often followed economic indicators: retail sales and housing market metrics.
A Closer Look at the Canadian Economy
Canada’s unemployment was unchanged at 7.1% in April as 2,100 jobs were lost, most of which were full time jobs.
Building permit activity declined -7.0% in March. Housing starts declined -5.4% to 191,500 in April.
In previous monthly updates we used the housing price data from Statistics Canada, but their figures always seemed way out of touch with news reports and numbers you’d see on realtor.ca. So instead going forward we will use the figures from the Teranet-National Bank Index. If you live in a small town that is not a suburb of one of the 11 largest cities in Canada then the StatsCan numbers may be more applicable to you. The gain for April 2016 was 1.23% and 7.11% over the last 12 months. As you would expect Greater Vancouver led the way at +2.16% and 18.32% (!) over the last 12 months. Outside of Vancouver, Victoria, Toronto and Hamilton (I guess its now a bedroom community of Toronto), the major cities in Canada have actually posted declines over the last 12 months with Halifax the worst at -5.5%.
Inflation was +0.3% in April. On an annual basis, the inflation rate rose +1.7%, and remains under the Bank of Canada’s target rate of 2%. Core inflation which excludes more variable items such as gasoline, natural gas, fruit & vegetables and mortgage interest was up +2.2% for the last year. Retail sales declined -1.0% in March, but were up +3.2% for the year.
GDP was again negative in March -0.2%, after February came in -0.1%. The annualized GDP growth rate was a strong +2.4%. With inflation remaining low and excess capacity remaining in the economy, the Bank of Canada left interest rates unchanged at +0.5%.
*Sources: MSCI, FTSE, Morningstar Direct, Trading Economics