On our website, anyone can submit a request for a portfolio review in which we look at the fees the client is paying and how well they are diversified. Most of the requests are from people that have a mutual fund account with a financial advisor at a bank or a mutual fund company.
Bill Wong (not his real name) sent us the statement for his Quadrus account last summer which we took a look at for him. Below is the list of mutual funds that Bill held, including the annual MER for each.
Fund Name Portfolio Weight Annual MER Quadrus Mackenzie Global Growth Q 10.0% 2.66% Quadrus Mackenzie Emerging Markets Q 13.5% 2.62% Quadrus Intl Equity Class (Putnam) Q 23.9% 2.79% Quadrus Canadian Dividend Class (GWLIM) Q 20.6% 2.52% Quadrus Mackenzie Canadian Large Cap Growth Class A 15.9% 2.54% Quadrus Canadian Value Class (Sionna) Q 16.1% 2.60%
Bill’s portfolio was invested solely in Quadrus funds, which are managed by outside managers such as Manulife, Putnam, and Sionna. Quadrus funds typically have high MERs, which in this case ranged from 2.52% to 2.79%, with a weighted average MER of 2.63%. That is much higher than the 2.30% that is typical for Canadian mutual funds.
Bill’s Asset Allocation
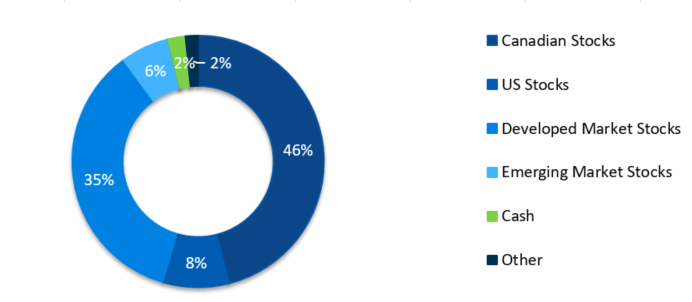
Next we looked at Bill’s asset allocation which was as follows:
This is an extremely aggressive asset allocation with nearly 100% in stocks. While many recommend very aggressive portfolios for young people who have very long investment time horizons, the high volatility of portfolios this aggressive often leads the investor to abandon their plan in turbulent markets. No ModernAdvisor portfolio is 100% stocks, and we would only recommend this for investors with extremely strong financial situations, long time horizons, and those who have successfully remained invested through severe market declines.
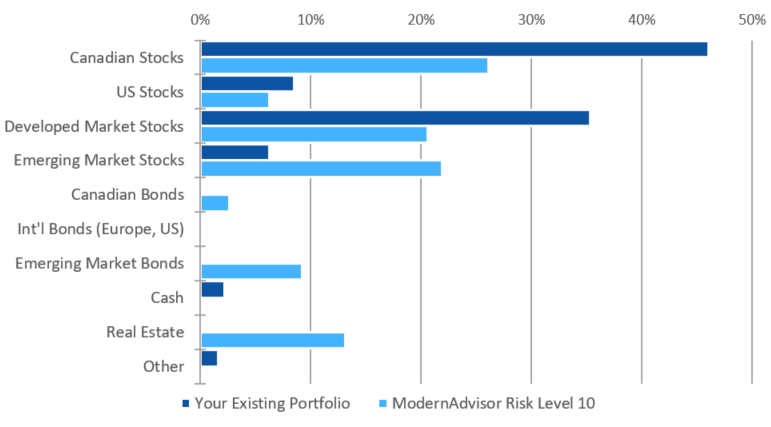
In comparing Bill’s portfolio to a ModernAdvisor portfolio, we selected our Risk Level 10 portfolio since it is our highest risk portfolio. Below is a comparison of Bill’s asset allocation to ModernAdvisor’s Risk Level 10.
On the stocks side, the ModernAdvisor Risk Level 10 portfolio has less exposure to Canadian and international developed market stocks than Bill’s portfolio, and has a much larger exposure to emerging market stocks. The ModernAdvisor portfolio also includes real estate investment trusts (REITs) and emerging market bonds both of which Bill’s portfolio didn’t have.
ModernAdvisor portfolios don’t hold developed country bonds such as US or European bonds, and typically hold very little cash.
Fees
Aside from the asset allocation, the major difference between Bill’s Quadrus portfolio and ModernAdvisor Risk Level 10 is fees. With his current mutual fund portfolio Bill is paying a weighted average of 2.63% in MERs every year! The weighted average of the MERs on the ETFs we use in our Risk Level 10 portfolio is only 0.23%.
That means on Bill’s portfolio he is paying $2,515 every year in MERs, whereas on the ModernAdvisor portfolio he would only be paying $220! Add in our management fee of 0.50% (plus GST) and he is looking at only $507 for the year. Over the long term, those fee savings compound quickly.
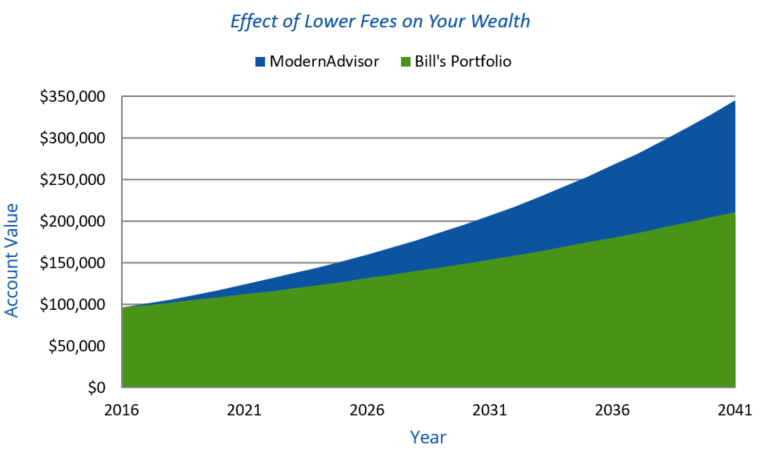
Since we can’t predict the future, and for simplicity, we’ve assumed in the above chart that both portfolios earned 6% every year before fees. The fee savings mean that Bill could potentially have an additional $134,000 after 25 years just by lowering his fees. Those substantial fee savings mean that Bill could retire years earlier than originally planned. A report from the Canadian Centre for Policy Alternatives found that investors using the highest fee fund companies in Canada might need to wait up to 7 years longer to retire, or retire with much lower account balances risking outliving their savings.
One expense of mutual funds that is rarely discussed is trading expenses. This is measured in the trading expense ratio, or TER. Actively managed mutual funds often have TERs of more than 0.20%. For small funds that trade a lot, a TER of 0.50% would not be unusual.
Fortunately for Bill the weighted average TER of the funds he holds is only 0.16%. That works out to $153 per year. Active mutual funds claim their high fees are justified by their active management, so we would have expected the TER to be higher which would indicate more active trading.
The weighted average of the TER on the ETFs in the ModernAdvisor portfolio is 0.00%. It is not really 0.00%; the ETF providers round anything under 0.005% to 0.00%. Even if we assume the TER was actually 0.0049% (which rounds to 0.00%), that would be only be $5 per year on Bill’s portfolio.
To summarize, the fees for both portfolios are:
| MER | MER in $ | Management fee rate | Management fee | TER | TER in $ | Total fees | |
|---|---|---|---|---|---|---|---|
| Bill’s Portfolio | 2.63% | $2,517 | 0% | $0 | 0.16% | $153 | $2,670 |
| ModernAdvisor Risk Level 10 | 0.23% | $220 | 0.53% | $507 | 0.00% | $5 | $732 |
| ModernAdvisor Savings | 2.40% | $2,297 | -0.53% | -$507 | 0.16% | $148 | $1,938 |
For substantially lower cost, Bill can switch to a ModernAdvisor portfolio saving thousands every year, while getting a more diversified portfolio. While we don’t currently offer any portfolios with 0% in bonds, with our new Custom Portfolios option for accounts over $150,000, we could build Bill a customized portfolio that is much better diversified than his existing portfolio even without including any bonds. The Custom Portfolios are a no additional cost option, so Bill could get exactly the portfolio he wants, while still paying substantially less in fees.
To see how much you can save, request a free mutual fund fee report or send a statement from your account to info@modernadvisor.ca.


