August is typically a quiet month for the markets, with many traders taking time off. If any negative news comes out then markets tend to drop quickly. For most of August, markets looked like typical summer markets, until out of nowhere, the Chinese government devalued their currency and Chinese stocks started dropping. This sent waves of panic around the world and the sell off spread as investors questioned future Chinese growth prospects. Fortunately, the US economy is continuing to show strength and Q2 growth was revised upwards by over 1%.
August 2015 Market Performance
All index returns are Total Return (includes reinvestment of dividends) and are in Canadian Dollars unless noted.
| Other Market Data | Month-end Value | Return for August |
2015 YTD Return |
| Oil Price (USD) | $49.20 | +4.41% | -7.64% |
| Gold Price (USD) | $1,132.50 | +3.43% | -4.36% |
| US 3 month T-bill | +0.08% | +0.04%* | +0.04%* |
| US 10 year Bond | +2.21% | +0.01%* | +0.04%* |
| USD/CAD FX rate | 1.3157 | +0.59% | +13.41% |
| EUR/CAD FX rate | 1.4763 | +2.77% | +5.16% |
| CBOE Volatility Index (VIX) | 28.43 | +134.57% | +48.07% |
*Absolute change in yield, not the return from holding the security.
All equity markets we track had a difficult month in August, however all closed the month off their lows. The S&P/TSX Composite is now down for the year, while the S&P500 and MSCI Emerging Markets indexes are now down for the year when measured in their home currency. European stocks, Japanese stocks and MSCI World remain positive for the year. See our post about international investing if you don’t already have international exposure in your portfolio.
Unsurprisingly, volatility indexes rose sharply to levels not seen since the autumn of 2011. Yes, that is an increase of 134.57% on the VIX for August, it’s not a typo.
When stock markets sell off, bond markets typically rise as investors flock to their relative safety. However, in August bond markets sold off as well. The FTSE/TMX Universe Bond Index was down -1% and global corporate and high yield bond indexes were also negative. Even US and German government bonds, which are usually safe havens, were down a little. Investors preferred gold in August, pushing the price up 3.6%. Oil dropped below $40 during August, but recovered its losses quickly and actually finished the month in positive territory. Most other commodities were down for the month; the broad Bloomberg Commodity Index was down -0.9%.
The Canadian Dollar continued to weaken in August. The price for a US Dollar rose above 1.32, before dropping back to finish the month at 1.3157. Against the Euro, the Loonie also lost ground, nearing 1.50 at one point.
Market Update
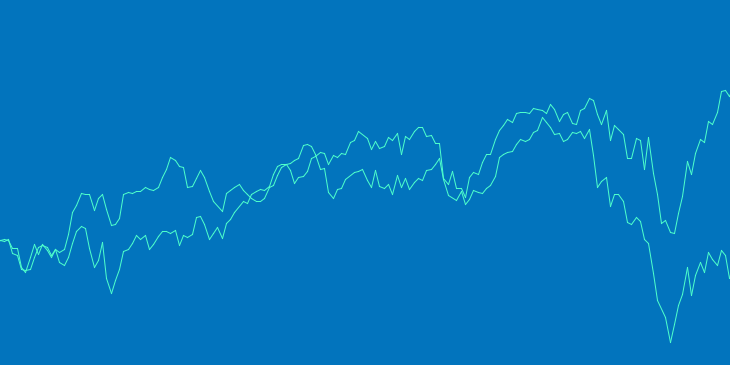
August started like a normal summer month, quiet with low trading volume, until the Chinese government devalued their currency and Chinese stocks started dropping quickly. Investors around the world started questioning the strength of the Chinese economy and what impact a slowing Chinese economy would have on the rest of the world, kicking off a multi-day global sell off. The S&P500 had 3 days in a row down -2% to -4% from August 20-24, after having only 3 days around -2% in the previous 18 months. Canadian markets weren’t hit quite as hard, having already been underperforming due to low oil prices. Stock markets have recovered some of their losses as investors started to recognize that the selling may have been overdone. The People’s Bank of China cut interest rates and the Chinese government started buying stocks, sending markets sharply higher.
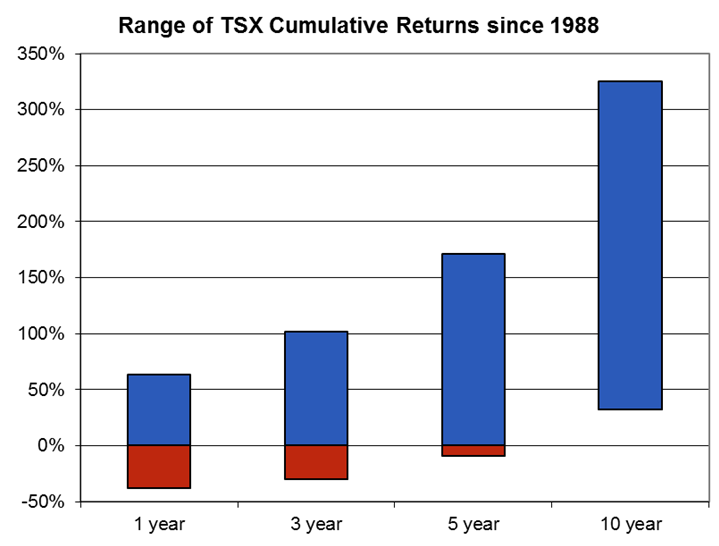
Stock markets have not been this volatile since August-November 2011 and it is a good reminder to investors that stocks are not short-term investments. When investing in stocks, the longer your time horizon, the less chance that your investments will be underwater. Since 1988, the worst 1 year return on the S&P/TSX Composite Index was -38%, the worst 3 year return was -30% and the worst 5 year return was -9%. Since 1988, as long as your holding period was at least 6 years you would have avoided being underwater, but even then the worst case was barely positive at +4%. The worst 10 year return was +32%.
Of course, the best returns in those timeframes are quite attractive, which is the whole point of owning stocks. While it can be difficult to stomach short term volatility, it is important to remember that long term returns can be very attractive.
August Economic Indicator Recap
Below are the current readings on the major economic indicators: central bank interest rates, inflation, GDP and unemployment.
Below are the current readings on a few other often followed economic indicators: retail sales and housing market metrics.
A Closer Look at the Canadian Economy
Canada’s unemployment rate was unchanged in July at 6.8%. 17,300 full time jobs were lost, well below the forecasted gain of 11,500. Part time job growth of 6,600 was also well below forecasts.
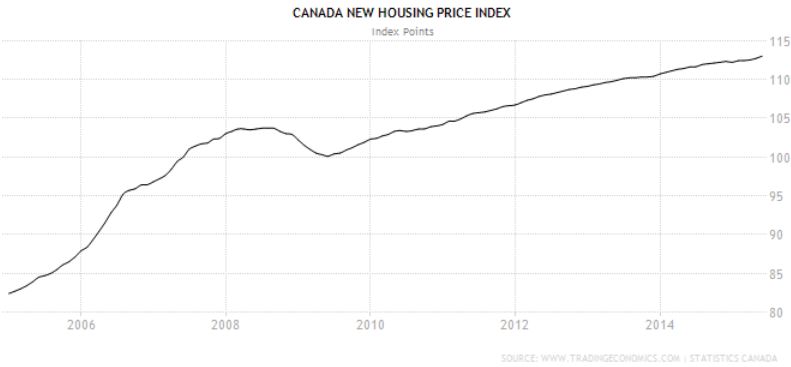
The reports on Canada’s housing market in August were mixed. Housing starts in July declined a little from June’s high of 202,300. Building permit activity in June rebounded sharply from May’s double digit drop. Since the dip in 2009, new house prices have been on a slow, steady rise and were up another 0.3% in June.
Inflation in Canada is starting to pickup, largely due to the drop in the Canadian dollar making imports more expensive. In July the Consumer Price Index (CPI) rose +0.1%, +1.3% over the last year. Core inflation which excludes more variable items such as gasoline, natural gas, fruit & vegetables and mortgage interest rose 2.4%. Retail sales in June rose 0.6%, and were up 1.4% over the part 12 months.
After 5 negative months, GDP was positive in June at +0.5%. Unfortunately that wasn’t enough to turn the second quarter positive. That means Canada had 2 negative quarters in a row (-0.2% in Q1 and -0.1% in Q2), indicating that the economy was in recession in the first half of 2015. Due to the time lag in receiving the reports, and the fact that June was the strongest in several months, it is possible that the recession has ended, making it unlikely that the Bank of Canada will need to cut interest rates at their September meeting.
*Sources: MSCI, FTSE, Morningstar Direct, Trading Economics


