
June was another good month for the equity markets, while fixed income continued to recover their first quarter losses.
June 2021 Market Performance
All index returns are total return (includes reinvestment of dividends) and are in Canadian Dollars unless noted.
| Other Market Data | Month-end Value | Return for June 2021 | 2021 YTD Return |
|---|---|---|---|
| Oil Price (USD) | $73.47 | +9.72% | +51.42% |
| Gold Price (USD) | $1,771.60 | -7.30% | -6.52% |
| US 3 month T-bill | +0.05% | +0.04%* | -0.04%* |
| US 10 year Bond | +1.45% | -0.13%* | +0.52%* |
| USD/CAD FX rate | 1.2394 | +2.67% | -2.65% |
| EUR/CAD FX rate | 1.4699 | -0.34% | -5.82% |
| CBOE Volatility Index (VIX) | 15.83 | -5.55% | -30.42% |
*Absolute change in yield, not the return from holding the security.
June was another good month for the equity markets, while fixed income continued to recover their first quarter losses.
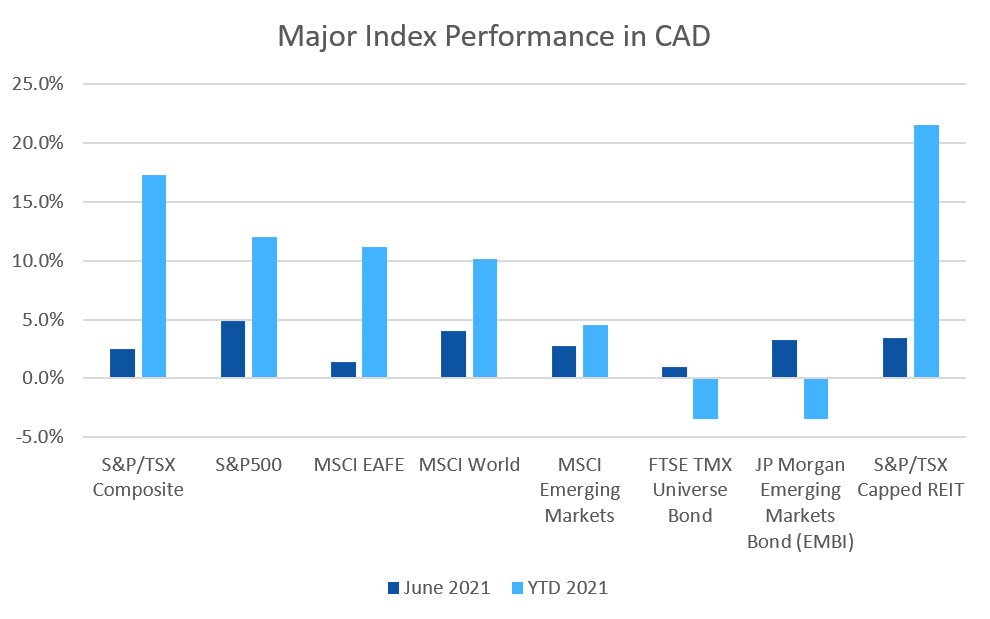
The S&P/TSX Composite was up +2.5% in June, and hit new all time highs. The TSX Comp. is now up more than 17% for 2021. The S&P/TSX Small Cap was up +1.0% for the month, and is up +19% for 2021. In the US, the large cap S&P500 was up +2.3% (+15.3% for 2021) while the small cap Russell 2000 index was up +1.8% for June and +17% for 2021. The tech focused Nasdaq was up +5.5% for June, and is up +12.5% for 2021.
The broad index of EAFE (Europe, Australasia & Far East) stocks was up +1.3% (+11.2% for 2021), European stocks were up +1.5%, and British stocks were up +0.2% for June. For 2021 European and British stocks are up +12.8% and +8.9%, respectively. Japanese stocks were again one of the few laggards, declining -0.6%. Emerging market stocks were up +0.5% for the month, and are one of the laggards for 2021 only up single digits: +7.0%.
Bonds were mostly positive in June. The major Canadian bond index, the FTSE/TMX Universe Bond Index, gained +1.0% in June while the FTSE/TMX Short-term Bond Index was down -0.2%. US investment grade bonds performed strongly; the ICE BoA AAA and BBB indexes gained +2.6% and +1.7% respectively for the month. High yield was up +1.4% for HY Master II and +1.9% for the CCC and lower (the real junky stuff) Index. Emerging market bonds put in their strongest performance in over a year, gaining +3.3%.
REITs had another good month, gaining +3.5% in June, and are up +21.5% for 2021.
Oil had another strong month, gaining +9.7% in June, and is now up +51.4% for 2021. Gold was down -7.3%, and is now down -6.5% for 2021. The diversified Bloomberg Commodities Index, gained +1.9% for June and is up +21.2% in 2021.
In June, the Canadian Dollar (CAD) lost -2.7% against the US Dollar. Against the Euro, CAD gained +0.3%, and +5.8% for 2021.
Commentary
When some investors hear that markets hit all time highs, their first thought may be “then the market is due for a pullback, maybe I should sell”. It is possible that a recent high will be the all time high for a while, but often that is not the case. Morgan Stanley looked at the last 30 years of performance for the S&P500 and found something interesting: your return is better if you invest at or near the all time high, rather than on any other day:
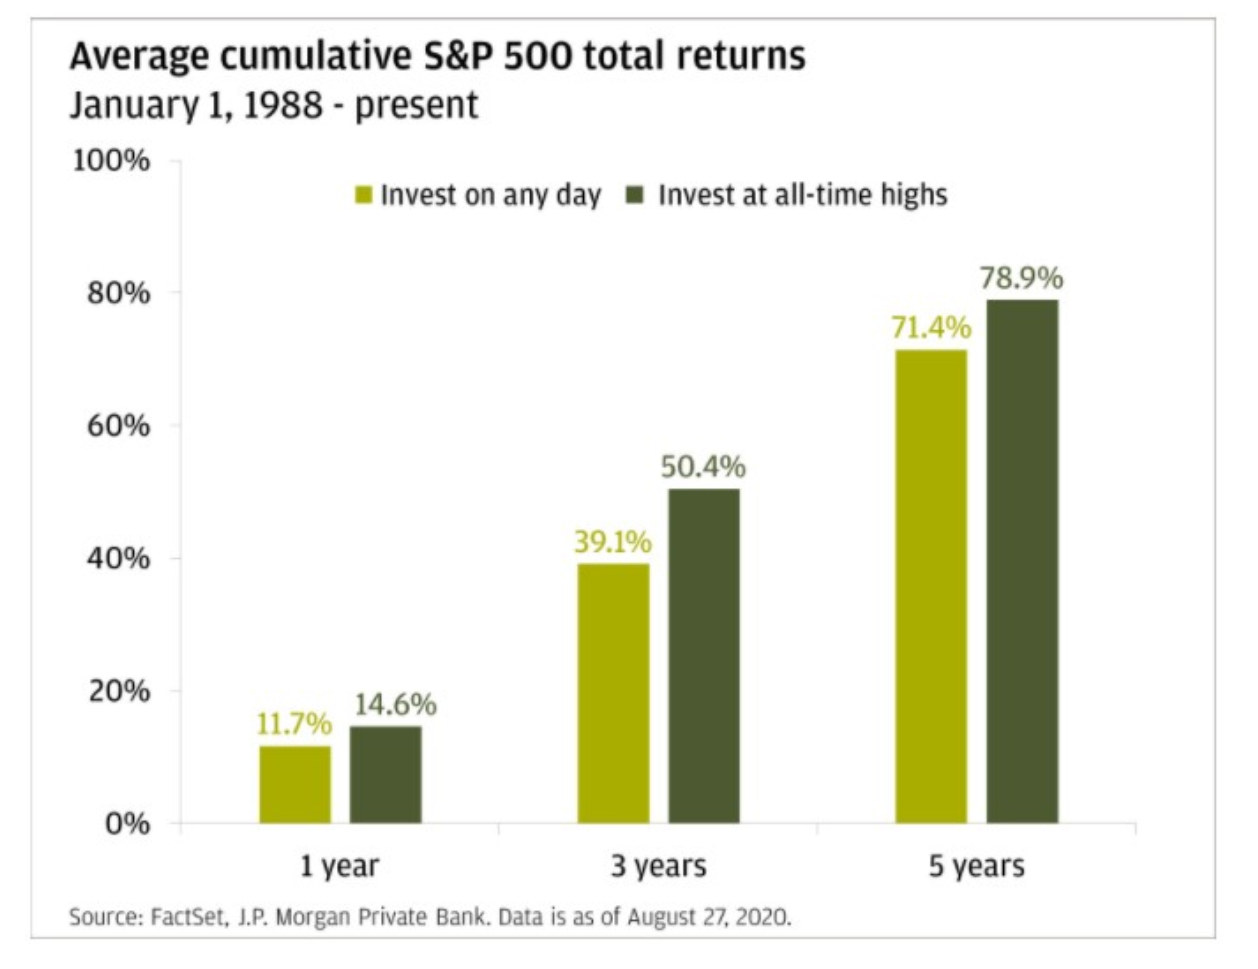 Over all of the three year time periods since 1988, your return over the 3 year time period was more 10% better if you invested at an all-time high!
Another way of looking at it is how often is the market at all time highs? I came across this interesting graph from Engaging Data:
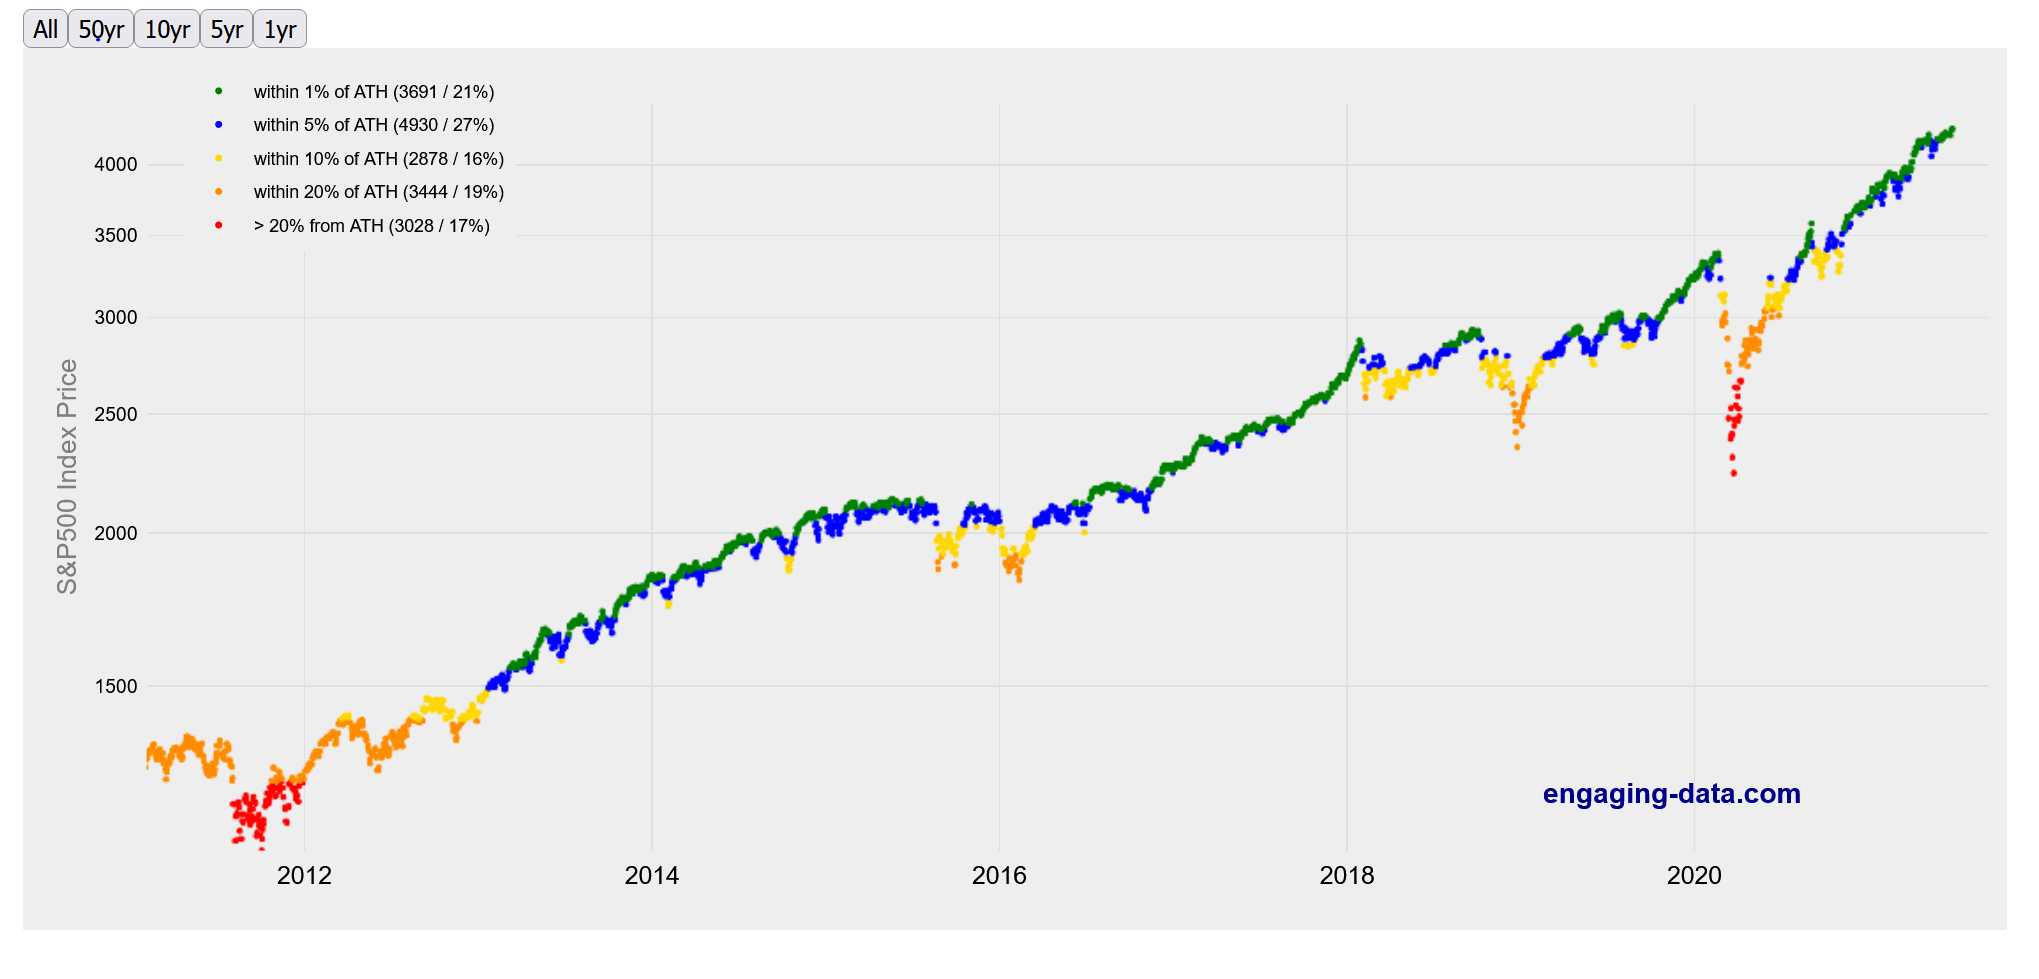 I’ve included the last 10 years above, but the data in the top left of the graph is from their full time series (begins 1950). Nearly half the time since 1950, the S&P500 was within 5% of its all time-highs. So chances are, if you wait for a pull back before investing, you can miss out on significant gains. For example, say you were thinking about investing in January 2013 when the S&P500 was at 1500, an all time high at that time. The S&P500 continued to rise throughout 2013; if you’d waited until the first pullback in June 2013 to invest, you would have been investing at 1575, missing out on a 5% return. If you’d waited until the next pullback of more than 5% (February 2014) you would be investing at 1750, and missed out on a 16.7% return compared to investing in January 2013.
So the next time you hear about the stock market being at an all time high, it could just be the best time to invest.
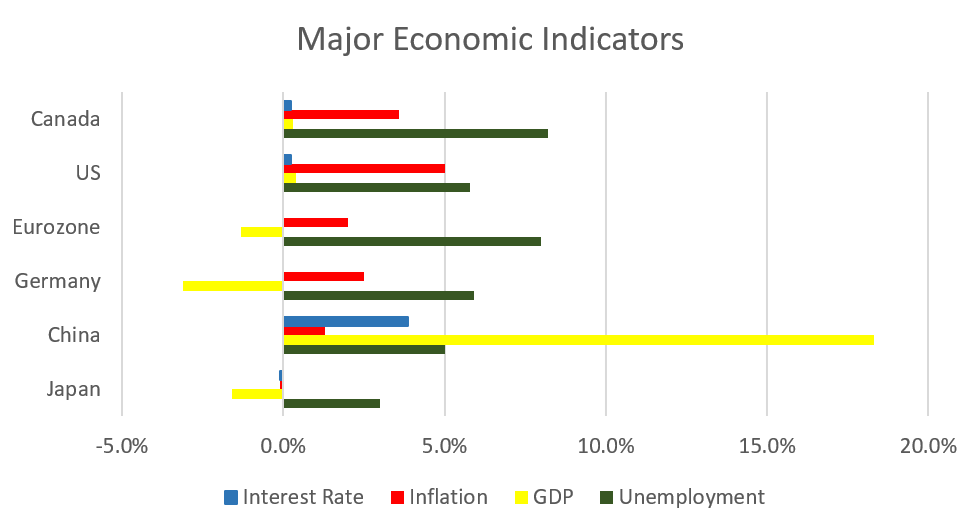
June 2021 Economic Indicator Recap
Below are the readings received in June for the major economic indicators: central bank interest rates, inflation, GDP and unemployment.
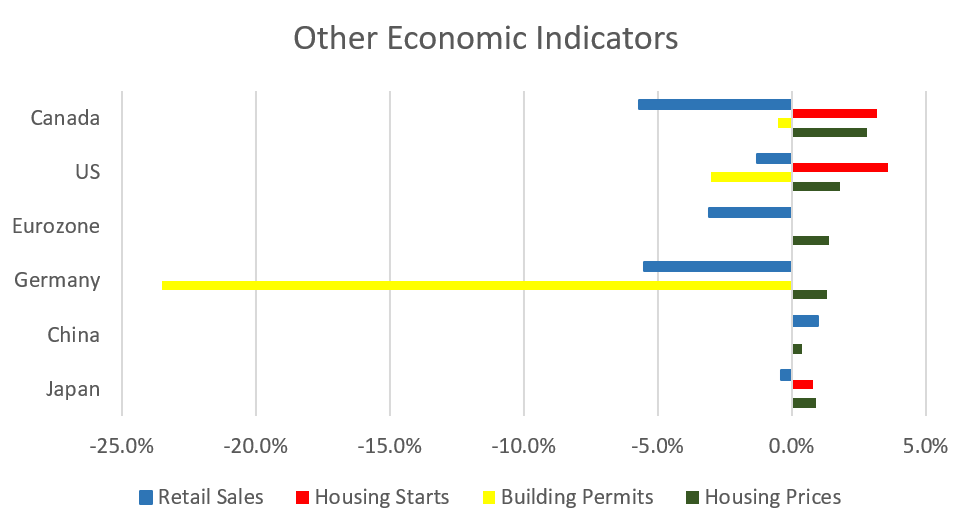
Below are the current readings on a few other often followed economic indicators: retail sales and housing market metrics.
A Closer Look at the Canadian Economy
Canada’s unemployment rate climbed to 8.2% in May. The economy lost 68,000 jobs during the month as pandemic restrictions were tightened in several provinces; 13,800 were full time jobs and 54,200 were part time jobs. Most of the job losses were seen in Ontario and Nova Scotia.
Housing prices across Canada were up +2.8% in May, the largest monthly gain since the Teranet index was created in 1999. Gains were led by Ottawa (+4.9%), Halifax (+4.3%) and Hamilton (+3.7%). For the third consecutive month all 11 major markets were positive.
The level of new housing starts rose 3.2% to 275,900 in May, above forecasts of 270,000. Urban housing starts rose +1.8%, with multi family construction rose +10.9%. Building permits slipped -0.5% in April to $11.1 billion, as declines in BC and Quebec residential sector declines outweighed gains elsewhere.
The inflation rate for May was +0.5%, and +3.6% on an annual basis, the largest increase in the inflation index since May 2011. Core inflation which excludes more variable items such as gasoline, natural gas, fruit & vegetables and mortgage interest was +2.8%. The rise in inflation was attributed mostly to a low level comparison to 2020, particularly for gasoline (+43.4%), and the homeowners replacement cost index (+11.3%), the largest increase since 1987 as higher building costs and demand for single-family homes continued to surge.
Retail sales were down -5.7% in April, the largest decline since April 2020 , amid store closures due to COVID-19. Sales declined in 9 of 11 subsectors including material and garden suppliers, clothing stores, and general retailers. Compared to a year ago, retail sales were down -7.2%.
Canada’s GDP was down -0.3% in April, the first decline in eleven months. 12 of 20 industrial sectors declined as gains in goods producing sectors were offset by losses in the services sector – primarily a -5.5% decline in the retail sector.
As expected, the Bank of Canada left its benchmark interest rate at 0.25% at the June 9th meeting. The benchmark interest rate is expected to remain at its current low level until into second half of 2022. The BoC maintained its quantitative easing program of purchasing at least $3 billion of government and corporate bonds per week. The next meeting is scheduled for July 14.
*Sources: MSCI, FTSE, Morningstar Direct, Trading Economics