
June was a good month for North American stocks, while international markets struggled. Bonds and REITS performed well.
June 2018 Market Performance
All index returns are total return (includes reinvestment of dividends) and are in Canadian Dollars unless noted.
| Other Market Data | Month-end Value | Return for June 2018 | YTD 2018 return |
|---|---|---|---|
| Oil Price (USD) | $74.15 | +10.61% | +22.72% |
| Gold Price (USD) | $1,251.30 | -3.75% | -4.43% |
| US 3 month T-bill | +1.93% | 0.00%* | +0.54%* |
| US 10 year Bond | +2.85% | +0.02%* | +0.45%* |
| USD/CAD FX rate | 1.3168 | +1.70% | +4.97% |
| EUR/CAD FX rate | 1.5360 | +1.60% | +2.05% |
| CBOE Volatility Index (VIX) | 16.09 | +4.28% | +45.74% |
*Absolute change in yield, not the return from holding the security.
The S&P/TSX Composite was up +1.7% in June, bringing the year to date to +1.9%. In the US, the S&P500 was up +0.5%, bringing the YTD to +2.6%. European stocks were down -0.5% in June; German stocks were down -2.4%, and UK stocks were down -0.5%. All are down for 2018 so far. Emerging market stocks were down -2.9% in June and are down -3.9% YTD.
The broad index of Canadian bonds, FTSE TMX Universe Bond Index was up +0.6% in June, while the FTSE TMX Short Term Bond Index was up +0.2%. US investment grade bonds were down in June and are down about -3.0% for 2018 YTD. High yield and junk bonds were positive, and the junkiest (CCC and lower) have performed well in 2018, up +4.0% through June. Emerging market bonds were up +0.2% in June, but are still down -0.5% for 2018 .
Canadian REITs had another good month, up +1.5% in June and +6.1% for 2018.
In June oil had its best month since early 2016, up +10.6%, and +22.7% for 2018. Gold was down again, helping to push the broad Bloomberg Commodity Index down -3.6% in June.
The Canadian Dollar gained +1.7% against the US Dollar, and +1.6% against the Euro in June.
Commentary – Q2 2018 performance update
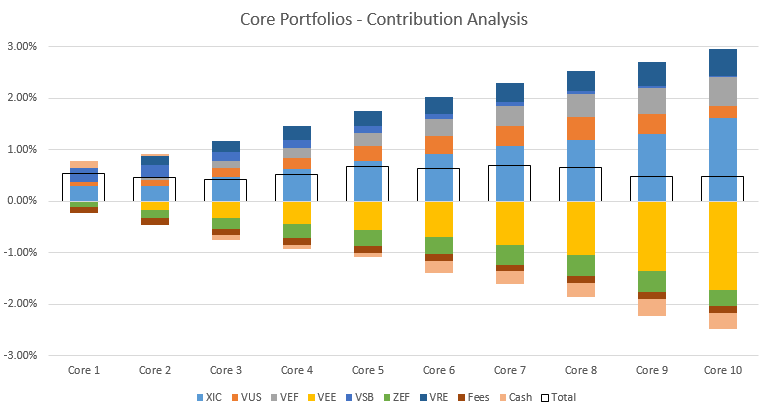
All risk levels of the ModernAdvisor Core and Socially Responsible portfolios were positive for the second quarter of 2018. Poor performance from emerging market stocks blunted the performance of the higher risk levels and flat performance from Canadian bonds kept performance of the lower risk portfolios low.
In the Core portfolios, the largest positive contributor was the Canadian stock ETF, XIC. International developed market stocks (VEF), real estate investment trusts (VRE), and US stocks (VUS) also contributed positively. Emerging market stocks (VEE) were the largest negative contributor, followed by emerging market bonds (ZEF), cash holdings (cash drag) and fees.
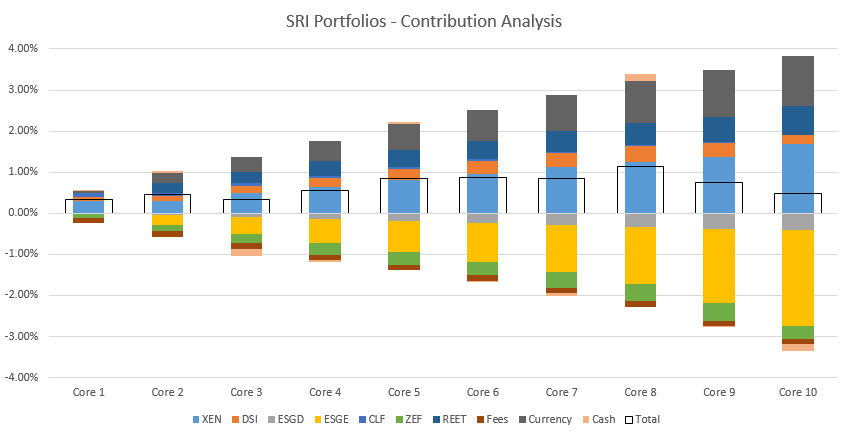
The Socially Responsible portfolios followed a similar pattern. Canadian stocks (XEN) were the largest positive contributor, followed by currency gains on DSI, ESGD, ESGE, and REET. Since those ETFs are priced in US Dollars, we’ve presented the currency effect separately from the performance of the ETFs themselves. Real estate investment trusts (REET) and US stocks (DSI) also contributed positively. As in the Core portfolios, emerging market stocks (ESGE) were the largest negative contributor, followed by emerging market bonds (ZEF) and international developed market stocks (ESGD).
If you’ve been with ModernAdvisor since the beginning you enjoyed good performance in 2016 and 2017. 2018 has so far seen markets that have been much less supportive of diversified portfolios. It is important to remember that all asset classes and investment strategies go through periods of underwhelming performance. A natural reaction is to want to make a change, try something else, basically do something when your portfolio is doing nothing. Long-term returns on the stock markets are strong, but the path to receiving those returns is long and tedious when they are going through one of their uncooperative periods. Patience is key when investing for the long-term, but hard to do these days when it’s easy to get anything you want with just a couple of clicks!
June 2018 Economic Indicator Recap
Below are the current readings on the major economic indicators: central bank interest rates, inflation, GDP and unemployment.
Below are the current readings on a few other often followed economic indicators: retail sales and housing market metrics.
A Closer Look at the Canadian Economy
Canada’s unemployment rate was unchanged at 5.8% in May for the fourth month in a row. 31,000 full time jobs were added in May while 23,600 part time jobs were lost.
Housing prices across Canada were up +0.9% in May with gains posted in 10 of 11 metropolitan areas. The largest gainers were Ottawa (+2.0%), Hamilton (+1.8%), and Edmonton (+1.5%). The only decliner was Winnipeg at -1.0%.
The level of new housing starts declined -9.8% in May to 196K, while the value of building permits issued in April declined -4.6%.
The inflation rate for May was +0.1%, and +2.2% on an annual basis. Core inflation which excludes more variable items such as gasoline, natural gas, fruit & vegetables and mortgage interest was+1.3%.
Retail sales were down -1.2% in April; compared to a year ago, retail sales were up +1.6%.
Canada’s GDP growth was +0.1% for April, led by a +0.2% gain from the goods side as manufacturing and utilities offset declines in construction and oil & gas. The services sector was flat.
*Sources: MSCI, FTSE, Morningstar Direct, Trading Economics