
January was a good month for most equity markets, but the Canadian market was left out. The US market was one of the top performers but quickly reversed at the start of February, reintroducing the concept of volatility to many investors.
January 2018 Market Performance
All index returns are total return (includes reinvestment of dividends) and are in Canadian Dollars unless noted.
| Other Market Data | Month-end Value | Return for January 2018 | 12 month return |
|---|---|---|---|
| Oil Price (USD) | $64.73 | +7.13% | +19.85% |
| Gold Price (USD) | $1,343.10 | +2.58% | +7.11% |
| US 3 month T-bill | +1.46% | +0.07%* | +0.93%* |
| US 10 year Bond | +2.72% | -0.32%* | +0.36%* |
| USD/CAD FX rate | 1.2293 | -2.01% | -7.44% |
| EUR/CAD FX rate | 1.5286 | -1.55% | +8.63% |
| CBOE Volatility Index (VIX) | 13.54 | +22.64% | +4.80% |
*Absolute change in yield, not the return from holding the security.
The S&P/TSX Composite was down -1.4% in January, one of the few major market indexes that was down for the month. In the US, the S&P500 was up +5.7%, its 15th positive month in a row when measured in USD and its strongest month since March 2016. European stocks were up +1.0% in January; German stocks were up +2.1%, while UK stocks were down -2.0%. Emerging markets were again one of the top performers, up +6.7% for the month.
On the bond side, the broad index of Canadian bonds, FTSE TMX Universe Bond Index was down -0.8% in January, while the FTSE TMX Short Term Bond Index was down -0.2%. US bonds were mixed; investment grade credits were negative while high yield was positive. Emerging market bonds were down again, this time -2.1%.
Oil was up +7.1% in January, gold was also up at +2.6%. The broad Bloomberg Commodity Index was up +1.9% for the month.
The Canadian dollar showed strength against the US Dollar in January, gaining +2.0%. Against the Euro the Canadian Dollar lost -1.6%.
Commentary
The volatility on the global stock markets at the start of February caught many people by surprise. For new investors it was a good, if unwelcome, reminder that most investments go down as well as up.
The press made much of the Dow Jones Industrial Average’s two drops of more than 1,000 points, of course forgetting to put that in perspective. If you start at 25,500, a drop of 1,000 points is a little less than -5%, which is not even in the top 10 worst days for that US stock market index. If you have a diversified portfolio and are investing for the long-term, then the recent volatility should be nothing to worry about.
At ModernAdvisor we’ve designed our portfolios for long term investors and include Canadian, US, developed and emerging market international stocks, REITs, and emerging market bonds. To help reduce the volatility we also include Canadian bonds with more in our lower risk portfolios and almost none in our riskiest portfolio.
We’ve got a little more than 2 years of history at ModernAdvisor now. While no major financial or market crises have occurred in that time frame, it does give us more than 500 daily returns for some of our portfolios. To help put the negative days in February into perspective, we took a look at the distribution of the daily returns for our Risk Level 8 portfolio.
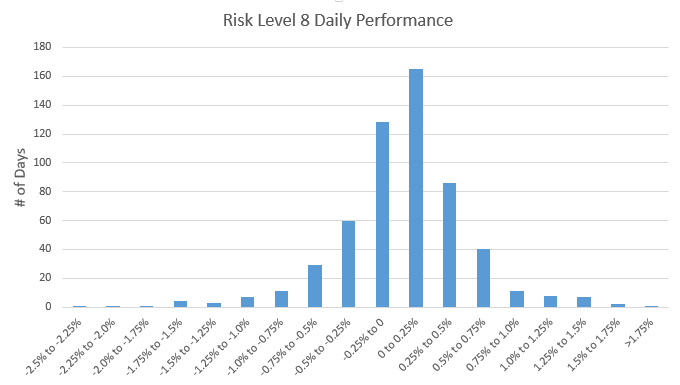
The first thing that jumps out is that the peak of the returns is skewed positive, as a result each positive return bucket is bigger than the corresponding negative return bucket. For example, the 0% to 0.25% bucket is bigger than the -0.25% to 0% bucket, 29.2% vs 22.7% of the days since we launched. And the 0.25% to 0.5% is bigger than the -0.5% to -0.25% bucket: 15.2% vs 10.6% of the days.
The big negative days are almost non-existent: the portfolio was down more than -2% in only 0.4% of the days (3 out of 565 days) since we launched. It is important to remember that these big negative days do happen but they are few and far between and actually have very little impact on your long term returns. Since we launched the portfolio, 57% of the daily returns were positive and 43% of the daily returns were negative. While that win-loss ratio might not sound very impressive, the annualized return of that portfolio is +10%.
The day to day movements in the stock markets are basically just noise, but over time you will see a trend, and the longer that time frame, the more obvious that upward trend becomes. That is important to keep in mind the next time the markets’ daily ups and downs throw you for a loop.
January 2018 Economic Indicator Recap
Below are the current readings on the major economic indicators: central bank interest rates, inflation, GDP and unemployment.
Below are the current readings on a few other often followed economic indicators: retail sales and housing market metrics.
A Closer Look at the Canadian Economy
Canada’s unemployment rate declined 0.2% to 5.7% in November, the lowest level seen since the 1970s. 54,900 part-time jobs and 23,700 full-time jobs were added.
Housing prices across Canada rose +0.2% in December, but only 5 of 11 metropolitan areas were positive. Most of the gain was the result of a +1.3% rise in Vancouver. Winnipeg and Halifax were both up +1.9%, but have a minimal impact on the index due to their smaller size. Victoria was top decliner at -1.0%, Calgary, Hamilton, Toronto, and Montreal were also down.
The level of new housing starts declined -13.8% in December, while the value of building permits issued in November declined -7.7%.
The inflation rate for December was -0.4%, and +1.9% on an annual basis. Core inflation which excludes more variable items such as gasoline, natural gas, fruit & vegetables and mortgage interest was+1.2%.
Retail sales were up +0.2% in November, or +1.6% excluding auto sales. Sales rose at gasoline stations, and electronics and appliance stores, while sales declined at new car dealers. Compared to a year ago, retail sales were up a healthy +6.5%.
Canada’s GDP growth was +0.4% for November; the goods producing sectors rose +0.8% while the services sector expanded +0.3%.
The Bank of Canada met on January 17, and as expected increased the benchmark interest rate to +1.25%.
*Sources: MSCI, FTSE, Morningstar Direct, Trading Economics