
December was a good month for stock markets around the world, and capped off a good year for our portfolios.
December 2017 Market Performance
All index returns are total return (includes reinvestment of dividends) and are in Canadian Dollars unless noted.
| Other Market Data | Month-end Value | Return for December 2017 | Return for 2017 |
|---|---|---|---|
| Oil Price (USD) | $60.42 | +5.26% | +12.47% |
| Gold Price (USD) | $1,309.30 | +2.84% | +13.68% |
| US 3 month T-bill | +1.39% | +0.12%* | +0.88%* |
| US 10 year Bond | +2.40% | -0.02%* | -0.05%* |
| USD/CAD FX rate | 1.2545 | -2.66% | -6.57% |
| EUR/CAD FX rate | 1.5052 | -1.81% | +6.23% |
| CBOE Volatility Index (VIX) | 11.28 | +10.81% | -19.66% |
*Absolute change in yield, not the return from holding the security.
The S&P/TSX Composite was up +1.2% in December, and was up +9.1% for 2017. In the US, the S&P500 was up +1.1%, its 14th positive month in a row when measured in USD. For the year, the S&P500 was up +21.8% in USD. European stocks were up +0.9% in December and +10.0% in 2017. Emerging markets were again one of the top performers, up +2.3% in December and were up +27.8% in 2017.
On the bond side, the broad index of Canadian bonds, FTSE TMX Universe Bond Index was down -0.4% in December and finished the year up +2.5%. The FTSE TMX Short Term Bond Index was also down for the month at -0.5%, bringing the 2017 performance to +0.1%. US bonds performed considerably better for the month and for the year. Most of the Merrill Lynch US bond indexes were up about +7% for 2017. Emerging market bonds were down -2.0% in December and finished 2017 up +3.0%.
Oil was up +5.3% for December and +12.5% for 2017. Gold was up +2.8% for the month and +13.7% for 2017. The broad Bloomberg Commodity Index was up +2.9 for December, turning the performance for 2017 positive at +0.7%.
The Canadian dollar showed strength in December, gaining +2.7% against the US Dollar and +1.8% against the Euro and was +6.6% and -6.2% for 2017, respectively.
Commentary
2017 was another strong year for most of our Core portfolios. With the global stock markets generally performing much better than bonds, the performance of our higher risk portfolios was driven by the equities side while Canadian bonds were a drag on performance. Emerging market bonds did a little better. Of the equities positions, emerging markets were the top performer, followed by US, EAFE (Europe, Australasia, Far East), and Canadian stocks. REITs were up 10%.
One of our most popular portfolios is our Risk Level 7 portfolio, not too surprising as it is closest to a traditional 60/40 balanced portfolio. Risk Level 7 was up +9.9% for 2017, out pacing the S&P/TSX Composite, and far ahead of Canadian bonds. If you’ve been following the daily bitcoin or marijuana stock headlines, +9.9% might not sound like much, but Risk Level 7 only posted 1 negative month (June) in 2017 when it was down less than -1%. Lets take a look at what drove that performance.
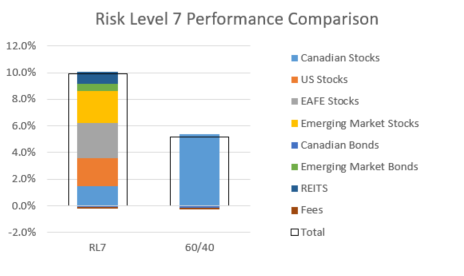
Of that +9.9%, US, EAFE and emerging market stocks were the primary positive contributors, each contributing 20% to 25% to the overall returns. Canadian stocks contributed 15% of the returns, and REITs and emerging market bonds contributed 9% and 6% respectively. Canadian bonds were the only asset class that contributed negatively, with a contribution of -1%, the same as fees.
If you were in a 60/40 portfolio that didn’t include any foreign stock or bond exposure, you would have earned only about +5% in 2017, as most foreign markets outperformed those in Canada.
What about SRI?
Approximately a third of our clients have an account invested in one of our socially responsible portfolios so lets take a look at how one fared in 2017.
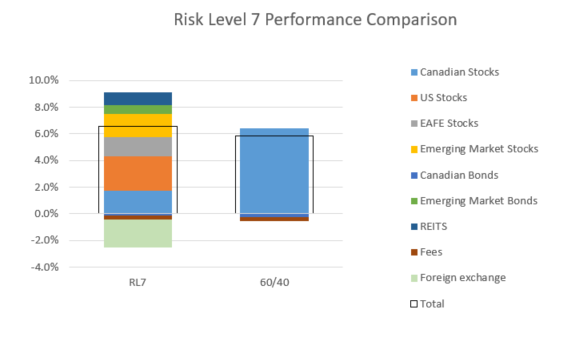
In July 2017 we expanded the exposure of our SRI portfolios to include EAFE and emerging market stocks. That happened to be a fortunate addition as the emerging market SRI ETF was the top performing ETF in that portfolio in the second half of 2017. Unfortunately, the US, EAFE, emerging market and REIT socially responsible ETFs are all US based and priced in US dollars, which means the SRI portfolios have much more US Dollar exposure than our Core portfolios. Our SRI Risk Level 7 portfolio was up +6.6% in 2017; we estimate that without the foreign exchange effects, the portfolio would have been up +8.8%. If US Dollar hedged SRI ETFs were available, we would certainly have used them as we used currency hedged ETFs in the Core portfolios.
US stocks were the largest positive contributor to performance, providing 39% of the return for 2017, Canadian and emerging market stocks both provided 27% of the return, EAFE provided 22%, REITs provided 14%, and emerging market bonds provided 10% of the return. On the negative side, the movement in the US/Cdn foreign exchange rate contributed -32% to the return, fees contributed -5% and Canadian bonds contributed -2%.
The SRI Risk Level 7 portfolio had four negative months in 2017, like the Core portfolios, the worst month was June at -1.5%.
If you were invested in a 60/40 SRI portfolio that didn’t include any foreign stocks or bonds, you wouldn’t have done quite as well as with the ModernAdvisor portfolio, but the gap was quite a bit smaller than with the Core portfolio.
December Economic Indicator Recap
Below are the current readings on the major economic indicators: central bank interest rates, inflation, GDP and unemployment.
Below are the current readings on a few other often followed economic indicators: retail sales and housing market metrics.
A Closer Look at the Canadian Economy
Canada’s unemployment rate declined -0.3% to 5.9% in November, the lowest level seen since before the financial crisis. 49,900 part-time jobs and 29,600 full-time jobs were added.
Housing prices across Canada declined -0.5% in November, the third monthly decline in a row. Hamilton was the top decliner at -1.6%, followed by Toronto at -1.4%. Vancouver and Victoria were flat, while Montreal was the top performer at +1.0%.
The level of new housing starts rose +13.2% in November, while the value of building permits issued in October rose +3.5%.
The inflation rate was up +0.3% in November, or +2.1% on an annual basis. Core inflation which excludes more variable items such as gasoline, natural gas, fruit & vegetables and mortgage interest was+1.3%.
Retail sales were up +1.5% in October, or +0.8% excluding auto sales. Sales rose +3.9% at new car dealers, +1.1% at food and beverage stores and +1.8% at diversified retailers. Compared to a year ago, retail sales were up a healthy +6.7%.
Canada’s GDP growth was flat in October; the services sector expanded +0.2% while the good sectors contracted -0.4%.
The Bank of Canada met on December 6, and as expected left the benchmark interest rate unchanged at +1.0%.
*Sources: MSCI, FTSE, Morningstar Direct, Trading Economics