
Stock markets finished 2016 on a positive note, with the S&P500 and TSX60 hitting all time highs in December. This time of the year, many prognosticators are bringing out their stock market forecasts for 2017. But given how far off the 2016 forecasts were, best to take them with a grain (or bucket) of salt!
December 2016 Market Performance
All index returns are total return (includes reinvestment of dividends) and are in Canadian Dollars unless noted.
| Other Market Data | Month-end Value | Return for December 2016 | Return for 2016 |
|---|---|---|---|
| Oil Price (USD) | $53.72 | +8.86% | +41.00% |
| Gold Price (USD) | $1,151.70 | -1.63% | +8.63% |
| US 3 month T-bill | +0.51% | +0.03%* | +0.35%* |
| US 10 year Bond | +2.45% | +0.08%* | +0.18%* |
| USD/CAD FX rate | 1.3427 | -0.01% | -2.98% |
| EUR/CAD FX rate | 1.4169 | -0.44% | -5.72% |
| CBOE Volatility Index (VIX) | 14.04 | +5.33% | -22.90% |
*Absolute change in yield, not the return from holding the security.
December saw its usual ‘Santa Claus’ rally, but of course Donald Trump is claiming credit for it. Most stock markets were positive and volatility declined.
The S&P/TSX Composite was up +1.4% for December, its eleventh positive month in a row. The S&P/TSX 60 (a large cap subset of the S&P/TSX Composite) hit a new all time high in December. The S&P500 was up +1.8% and hit several new all time highs in December. Japanese stocks also performed well and were up 4.4% for the month. The biggest winner was the German stock market which was up +7.9%. The only stock markets that didn’t perform well were the emerging markets.
In Canada, the broad FTSE TMX Universe Bond Index was down -0.5% for December. Outside of Canada, the bond markets performed well for the month. US bonds performed well, with indexes of lower quality bonds performing best. The high yield bond indexes were positive across the board, as were emerging market bonds.
Oil had a strong month in December, up +8.7%, while gold was down -1.6%. The broad Bloomberg Commodity Index was up +1.8%.
The Canadian dollar was unchanged against the US dollar in December, and gained +0.4% against the Euro.
Commentary
Did you read the stock market forecasts for 2016 at the start of last year? If so, did they influence what you did with your investments? Hopefully you ignored them as most market forecasts are nearly always wrong!
I dug up a few of the forecasts for 2016 to give you a feel for why it is important to stick to your plan and ignore the noise that the media is constantly pumping out to get viewers, readers and clicks to make money from.
For example, in February 2016 Business Insider surveyed Wall Street analysts on where they thought the S&P500 Index would finish 2016. At that time the S&P500 was down -9%, in one of the worst starts to the year it had seen in decades. So as you might expect, the analyst forecasts for the S&P500 in 2016 were somewhat subdued. The forecasts ranged from an index level of 2000 to 2325. Goldman Sachs was one of the more pessimistic ones, predicting 2100 in July 2016. The S&P500 finished the year at 2238.
A Forbes survey of analysts found a 7-11% return expectation for 2016 for an ETF that tracks the S&P500. With dividends in, the S&P500 was up 12%. The more optimistic forecasters were close, but still a little off.
Analysts at Canadian banks who provided TSX performance estimates for 2016 were similarly wrong. The more optimistic forecasts were calling for 13-15%. The TSX returned 21%. However, the analysts were correct in their prediction of Canadian stocks outperforming US stocks in 2016.
Every once in a while a forecaster gets very close, as Brian Belski did for 2016. He predicted the TSX would finish 2016 at 15,300; the TSX finished at 15,287.
The markets were pretty much all in the black for 2016, so anyone calling for a crash was sorely mistaken. If you’ve been reading 2017 market forecasts, make sure to take them with a grain (or bucket) of salt.
So how did the various asset classes fare in 2016? Even EAFE stocks (Europe, Australia, and Far East), were positive for 2016, although they were negative for most of the year.
For Canadian stocks, 2016 was the best year for the S&P/TSX Composite since the financial crisis ended in 2009. Heading into 2016, the average return on the TSX was +8.9% for the 1994-2015 period. So at +21.1% the TSX did quite a bit better than average. The S&P500 and Canadian REITs also did better than their averages. MSCI EAFE, MSCI Emerging Markets and emerging market bonds all performed below their 1994-2015 averages. The real laggard was Canadian bonds which returned only 1.7%, well below their average for that period.
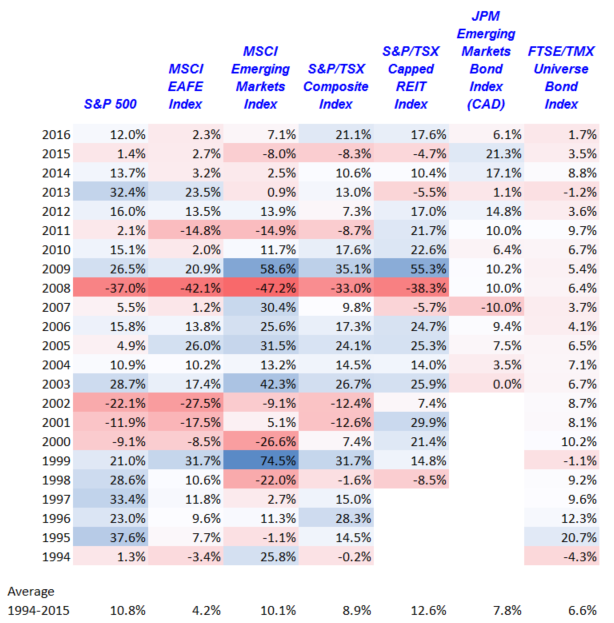
The table above is a good reminder of why having a globally diversified portfolio that includes stocks, bonds, and REITs is important. If you’d abandoned stocks in 2001 or 2002 and switched to bonds instead, you would likely have missed the strong performance that stocks saw in 2003. Similarly, in 1994, the only area that did really well was emerging market stocks, everything else was flat to negative.
December Economic Indicator Recap
Below are the current readings on the major economic indicators: central bank interest rates, inflation, GDP and unemployment.
Below are the current readings on a few other often followed economic indicators: retail sales and housing market metrics.
A Closer Look at the Canadian Economy
Canada’s unemployment rate declined to 6.8% in November as 10,700 new jobs were added; 19,400 part time jobs were added and 8,700 full time jobs were lost. The decline in the labour force participation also contributed to the decline in the unemployment rate.
Housing prices across Canada rose +0.2% in November. Hamilton (+1.4%), Toronto (+1.1%), Montreal (+0.9%), Calgary (+0.7%), Halifax (+0.6%), Victoria (+0.4%), and Quebec City (+0.4%) all posted monthly gains that were above the national average. Vancouver posted its second monthly decline, this time -1.3%.
The number of new housing starts rose slipped -4.3% to 184,000 in November. Building permit activity in October rose +8.7%.
The inflation rate turned negative in November at -0.4%. On an annual basis, the inflation rate was +1.2%, and remains under the Bank of Canada’s target rate of 2.0%. Core inflation which excludes more variable items such as gasoline, natural gas, fruit & vegetables and mortgage interest was +1.5% for the last year, the lowest reading in more than 2 years. Retail sales were up +1.1% in October, or +1.4% when excluding auto sales. Compared to a year ago, retail sales were up +3.8%.
GDP was down -0.3% month over month in October, the 4th negative month out of the last 9. The decline was attributed to declines in manufacturing output and lower oil and gas extraction. Manufacturing contracted -2% the largest decline since December 2013.
Up until October, economic growth had been recovering from the first quarter of 2016’s slump. The Bank of Canada left the benchmark interest rate unchanged at their December meeting after previously lowering their growth expectations for 2017 and 2018. Some economists are now expecting the BoC to cut interest rates by 0.25% to 0.25% sometime in 2017. In the US, the Federal Reserve is expected to raise interest rates by at least 0.25% in 2017. That combined with the BoC rate cut is likely to mean a lower Canadian dollar in 2017.
*Sources: MSCI, FTSE, Morningstar Direct, Trading Economics