
December 2018 was the worst December in 25 years. Stock markets were down around the world; Canadian and emerging market bonds were one of the few bright spots.
December 2018 Market Performance
All index returns are total return (includes reinvestment of dividends) and are in Canadian Dollars unless noted.
| Other Market Data | Month-end Value | Return for December 2018 | YTD 2018 return |
|---|---|---|---|
| Oil Price (USD) | $45.41 | -10.84% | -24.84% |
| Gold Price (USD) | $1,281.30 | +4.51% | -2.14% |
| US 3 month T-bill | +2.45% | +0.08%* | +1.06%* |
| US 10 year Bond | +2.69% | -0.32%* | +0.29%* |
| USD/CAD FX rate | 1.3642 | +2.56% | +8.74% |
| EUR/CAD FX rate | 1.5613 | +3.62% | +3.73% |
| CBOE Volatility Index (VIX) | 25.42 | +40.68% | +130.25% |
*Absolute change in yield, not the return from holding the security.
December is typically the best month of the year for Canadian stocks. Over the past 25 years, the S&P/TSX Composite has only been down in five Decembers; with an average monthly return of 1.99%, December is by far the best month. But this year, the TSX was down -5.4% in December (its worst December in last 25 years), bringing the return for the year to -8.9%, the worst year since the 2008 financial crisis, but only slightly worse than 2011 and 2015.
The S&P500 was worse in December than the TSX at -9.0%, also its worst December in the last 25 years and the worst monthly return since the 2008 financial crisis ended.
EAFE (Europe, Australasia & Far East) stocks were down -6.0% for December and -13.4% for 2018. European stocks specifically were down -13.1% for 2018. British stocks were also down in December and down -12.5% for 2018.
Emerging markets which had been getting a bad rap this year, were one of the better performers in December at -2.8% and actually did a little better than EAFE at -12.3% in 2018.
Canadian bonds were one of the few bright spots in December. The FTSE/TMX Universe Bond Index was up +1.3% in December and up +1.4% for 2018. The FTSE/TMX Short-term Bond index was up +0.9% for December and +1.9% for 2018.
Emerging market bonds did particularly well in December at +4.2%, saving the year for that asset class: +4.4% for 2018. REITs also did well in 2018 at +6.3%, despite the -3.4% in December.
Commodities, often considered a diversifier didn’t help much in 2018. The Bloomberg Commodities Index finished the year down -13.0%. Oil was down -24.8%, and the ‘safe haven’, gold, was down -2.1%.
The Canadian Dollar (CAD) was also down in December and for 2018. Against the US Dollar, CAD lost -2.6% in December and -8.7% in 2018. Against the Euro, CAD lost -3.6% in December and -3.7% for the year.
Commentary – 2018 Performance Review
December was an unusually challenging month, capping off a challenging year.
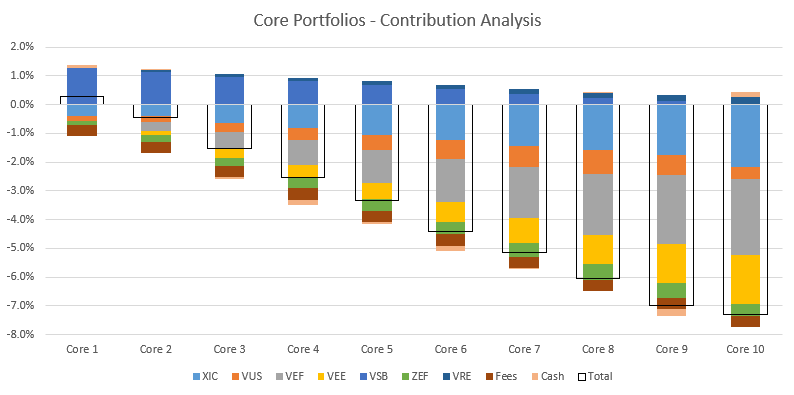
In our Core portfolios in 2018, only our Canadian bond and REIT ETFs (VSB and VRE, respectively) contributed positively, and those positive contributions were solely from the distributions received. As noted above, all major equity markets were negative for 2018 which was reflected in the performance of the ETFs we use to gain exposure to those markets. All of the ETFs we use are designed to track a specific stock or bond market index, less a very modest fee.
Our lowest risk levels benefited from their exposure to Canadian bonds which helped to offset the small losses on their equity market exposure. In our riskier portfolios, international developed market stocks (VEF) was the largest negative contributor, followed by Canadian stocks (XIC) and emerging market stocks (VEE). US stocks (VUS) and emerging market bonds (ZEF) also contributed negatively but to a much smaller degree due to their small allocations.
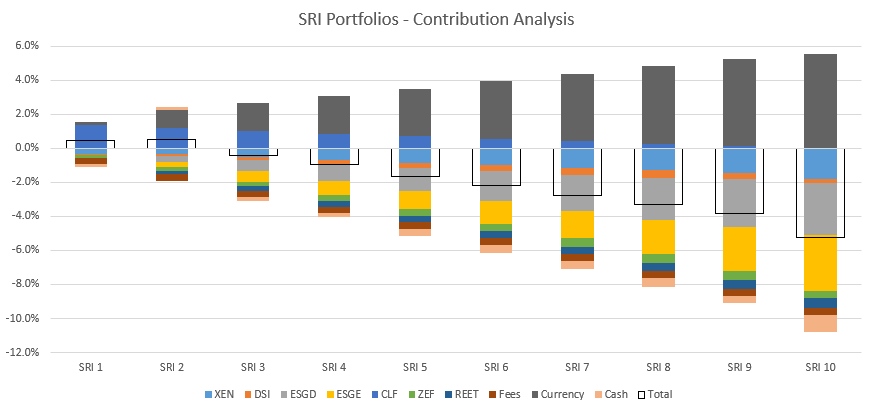
Our SRI portfolios performed a little better than the Core portfolios, mostly due to their US Dollar (USD) exposure. The ETFs we use for exposure to US, international equity exposure, and for REITs trade on US stock markets in USD, so we present the effect of changes in the USD separately from the return on the respective stock markets themselves. As in the Core portfolios, large exposures to Canadian bonds (CLF) helped offset losses on equity market exposure in the lower risk portfolios. In the riskier portfolios, international developed market exposure (ESGD) was the largest negative contributor followed by emerging market stocks (ESGE). Canadian stocks (XEN) also contributed negatively, followed by small negative contributions from emerging market bonds (ZEF), REITs (REET), and US stocks (DSI).
January 2019 update
As is common when stock markets post large declines absent any economic or political reasons, January has seen a strong bounce back on global stock markets. The recent volatility has already subsided to more ‘normal’ levels, and our portfolios have recovered most of their losses from 2018. This is a good reminder that volatile markets are temporary as are the related declines. With long investment time horizons, the recent stock market declines will only show as blips on the charts.
If the declines caused you anxiety or panic, you should re-examine your risk appetite, as you are likely taking much more risk than you’re comfortable with. Conversely, if you simply shrugged and carried on after seeing the resent declines, then you’re likely invested as you should be.
December 2018 Economic Indicator Recap
Below are the current readings on the major economic indicators: central bank interest rates, inflation, GDP and unemployment.
Below are the current readings on a few other often followed economic indicators: retail sales and housing market metrics.
A Closer Look at the Canadian Economy
Canada’s unemployment rate declined -0.2% in November to 5.6% with 94,100 new jobs added; 89,900 were full time jobs and 4,200 part time jobs.
Housing prices across Canada were down -0.3% in December, the third negative month in a row. 7 of 11 metropolitan markets were down; Edmonton (-1.4%), Vancouver (-1.2%) and Winnipeg (-0.9%) were the worst decliners. Ottawa was the largest gainer at +1.0%.
The level of new housing starts rose +4.4% in November to 216K, while the value of building permits declined -0.2% in October to just under $8.1 billion.
The inflation rate for November was -0.4%, and 1.7% on an annual basis, the lowest rate since January. Core inflation which excludes more variable items such as gasoline, natural gas, fruit & vegetables and mortgage interest was +1.5%.
Retail sales rose +0.3% in October, compared to a year ago, retail sales were up +0.6%. The annual gain in October was the smallest gain since January 2015. Sales were up at new and used car dealers, gas stations, and miscellaneous stores (boosted by the inclusion of cannabis stores).
Canada’s GDP rose +0.3% in October, with 15 of 20 industrial sectors posting gains. Construction, transportation and warehousing, and agriculture, forestry, fishing and hunting, were among the decliners.
The Bank of Canada left its benchmark interest unchanged at +1.75% at its December 5th meeting. Many analysts had previously predicted that the Bank of Canada would raise interest rates twice in 2019 (0.25% each time), but many are now calling for no change to the benchmark rate in 2019 and some calling for a 0.25% cut.
*Sources: MSCI, FTSE, Morningstar Direct, Trading Economics