April was a good month for Canadian and European stocks helping to offset declines in bond markets.
April 2018 Market Performance
All index returns are total return (includes reinvestment of dividends) and are in Canadian Dollars unless noted.
| Other Market Data | Month-end Value | Return for April 2018 | YTD 2018 return |
|---|---|---|---|
| Oil Price (USD) | $68.53 | +5.53% | +13.42% |
| Gold Price (USD) | $1,316.00 | -0.85% | +0.51% |
| US 3 month T-bill | +1.87% | +0.14%* | +0.48%* |
| US 10 year Bond | +2.95% | -0.21%* | +0.55%* |
| USD/CAD FX rate | 1.2836 | -0.45% | +2.32% |
| EUR/CAD FX rate | 1.5509 | -2.26% | +3.04% |
| CBOE Volatility Index (VIX) | 15.93 | -20.23% | +44.29% |
*Absolute change in yield, not the return from holding the security.
The S&P/TSX Composite broke its 3 month losing streak in April and was up +1.8%. In the US, the S&P500 was up +0.4%, while the Russell 2000 (an index of small cap stocks) was up +0.8%. European stocks had a great month, up +4.3% overall; German stocks were also up +4.3%, while UK stocks were up +6.4%. Emerging market stocks were up +1.1% in April.
With stocks generally having a great month, it is unsurprising that bonds were down in April. The broad index of Canadian bonds, FTSE TMX Universe Bond Index was down -0.8% in April, while the FTSE TMX Short Term Bond Index was down -0.1%. Both remain up marginally for 2018. US bonds were mixed; high yield bonds were positive while investment grade credits were down for the month. Emerging market bonds were down -2.0% in April.
Canadian REITs were marginally positive.
Oil had another strong month and was up +5.5% in April, and is now up +13.4% for 2018. Gold was down -0.9% in April; the broad Bloomberg Commodity Index was up +2.4%.
The Canadian Dollar rose +0.4% against the US Dollar and +2.3% against the Euro.
Commentary
At ModernAdvisor we’ve been reviewing client portfolios for over 3 years. What the majority of them have in common is a lack of emerging markets exposure. They all have exposure to Canadian stocks and US stocks. Most of the clients that ask us to review their existing portfolios before they move to ModernAdvisor also have some exposure to international developed markets like Europe and Japan. If they have an international stock mutual fund it might have a small amount (less than 10%) in emerging markets. If that mutual fund is 20% of their portfolio, that would work out to 2% emerging market exposure in their entire portfolio. Very few people have a dedicated emerging market fund; more people will have a real estate or natural resources fund.
With the exception of our lowest risk levels, all of our ModernAdvisor portfolios have some emerging market stock and bond exposure; about 3% in our lowest risk portfolio up to 32% in our highest risk portfolio.
When you run the numbers, exposure to emerging markets can add significant value to Canadians’ investment portfolios. Since 1994, the annualized return on the S&P/TSX Composite was +5.4%. The annualized return on the MSCI Emerging Market Index was +7.4%, 2% PER YEAR more than Canadian stocks! That period includes the significant drawdowns that occurred in the 1998 Asian currency crisis and the 2008 global financial crisis. That 2% outperformance would be almost enough to make up for the average annual mutual fund fee in Canada.
So why don’t more clients have emerging markets exposure in their portfolios? With the average Canadian focused on return you would think that the 2% return ‘bonus’ would be attractive. The 1998 crisis likely spooked advisors that were considering using emerging markets or that already had it in the clients’ portfolios. Then there was the 2001 tech meltdown and the 2008 financial crisis. They likely decided to just stick with Canadian and US stocks because the evening news typically only includes those quotes in their ‘business’ report.
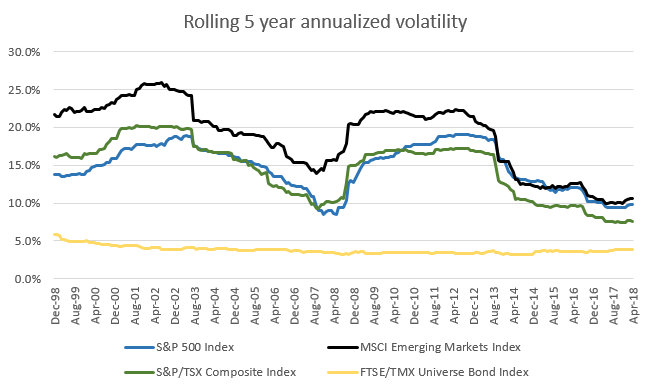
Emerging markets have historically been more volatile than US and Canadian stock markets. From the 5 year period ending December 1998 to 2002, the MSCI Emerging Market Index had volatility about 5% higher than the S&P500 or S&P/TSX Composite. From 2002 to 2008 that volatility gap shrunk a little before widening again following the 2008 financial crisis. After the 2008 financial crisis rolled off the 5 year period, the volatility of the emerging markets index dropped to the same level as the S&P500. So volatility shouldn’t be a reason to avoid emerging markets.
Another metric to consider is the valuation of the markets represented in your portfolio. The US stock market remains the most expensive in the world on both an absolute basis and relative to its historical average. If you believe in mean reversion, you would expect the valuation of the US stock markets to eventually return to their historical average, either by declining quickly or by posting flat returns for several years. Emerging markets on the other hand, have valuations below their historical average, implying there is a lot more upside to its future returns than for US stocks.
Research Affiliates’ 10 year expected return for emerging markets is 8.4% annualized, versus 2.7% for US stocks. Another way to look at it is: the probability of earning a 5% real return in US markets is 2%, whereas in emerging markets the probability is 62%.
With US stocks having done well recently, many people have likely forgotten about the benefits of diversifying globally. With the US president looking to implement more tariffs and other trade restrictions with countries around the world, the bloom is likely to come off US stocks. Especially as more countries retaliate against the US. Emerging markets have matured a lot since the 1998 Asian currency crisis and are a lot less dependent on the currency inflows and the US. There are many positives to including emerging markets in your portfolio, hopefully more advisors and their clients will consider adding emerging markets to their portfolios.
April 2018 Economic Indicator Recap
Below are the current readings on the major economic indicators: central bank interest rates, inflation, GDP and unemployment.
Below are the current readings on a few other often followed economic indicators: retail sales and housing market metrics.
A Closer Look at the Canadian Economy
Canada’s unemployment rate was unchanged at 5.8% in March as 68,300 full time jobs offset the loss of 32,300 part time jobs.
Housing prices across Canada were flat in March with only 4 of 11 metropolitan areas were positive. The positive markets were Victoria (+1.0%), Vancouver (+0.5%), Winnipeg (+0.5%) and Quebec City (+0.1%). The largest decliners were Edmonton at-1.3% and Halifax at -1.0%.
The level of new housing starts declined -2.5% in March to 225K, while the value of building permits issued in February declined -2.6%.
The inflation rate for March was +0.3%, and +2.3% on an annual basis. Core inflation which excludes more variable items such as gasoline, natural gas, fruit & vegetables and mortgage interest was+1.4%.
Retail sales were up +0.3% in January; compared to a year ago, retail sales were up a healthy +3.6%.
Canada’s GDP growth was +0.4% for February, led by a rebound in oil & gas and mining and manufacturing. The Bank of Canada met on April 18, and as expected left the benchmark interest rate at +1.25%.
*Sources: MSCI, FTSE, Morningstar Direct, Trading Economics


