
Well, January has been fun so far! After the Santa Claus rally failed to materialize in December, the selling continued into the New Year. With RRSP season just around the corner this sell off might have you reconsidering contributing to an RRSP before the deadline on February 29.
While the sell off on stock markets around the world has been quick and dramatic, its not actually that unusual. We looked at monthly data for the S&P/TSX Composite, S&P500 and the MSCI EAFE indexes going back to 1970 to see how often losses of this magnitude occur.
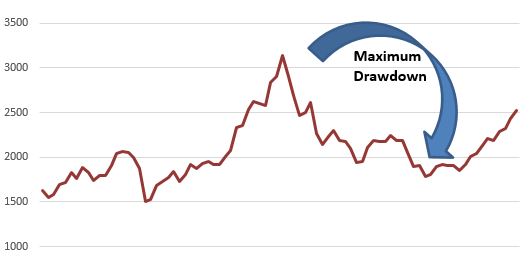
One of the easiest ways to measure losses is to look at drawdowns. A drawdown measures the performance loss of an index (or stock, or bond, or anything really) from its peak to its current value or its lowest value before recovery begins.
Drawdowns Since 1970*
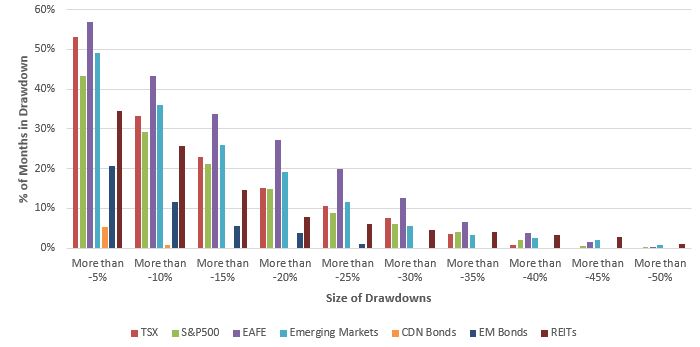 * Since 1980 for CDN Bonds, 1988 for Emerging Markets, 1994 for EM Bonds and 1998 for REITs.
In 23% of the months (127 months) since 1970, the S&P/TSX Composite has been in a drawdown of more than 15% (the current drawdown as of January 15 is 19.4%). The S&P500 has fared better recently and is only down -9.7% from its peak. But drawdowns of 15% or more occur with a similar frequency as with the TSX, 21% of the months since 1970. A widely followed measure of international stocks, the MSCI EAFE, fared even worse. In 34% of the months since January 1970 it was in a drawdown of more than 15%.
If you were invested in the stock market in 2008, a drawdown of 15% would seem like a picnic on a beautiful summer day in comparison to the drawdowns then of just over 50%, or a loss of half of the value. Thankfully since 1970 that has only occurred in 0.2% of the months for the S&P500 and EAFE, and the TSX’s worst drawdown was -43%. Given the past history of those indexes, the probability of seeing 2008-like drawdowns is low.
Stocks have performed poorly, but what about bonds and real estate?
So all in all, the current drawdowns on the stock markets, while uncomfortable for many, are no reason to panic. If you have a well diversified portfolio with low fees, you should be in good shape. Part of having a well diversified portfolio is owning bonds and REITs, not just stocks.
The Canadian bond market, measured in this case by the FTSE/TMX Universe Bond Index has been fairing pretty well. It’s current drawdown is negligible at -0.01%. And it has rarely seen a drawdown of more than 10%. One of the major ones was in 1981 when interest rates hit 20% and another occurred in 1994 when bond markets had a major hiccup, but since then the drawdowns have been few and far between.
Another asset class we use at ModernAdvisor is emerging market bonds. Like Canadian bonds, they have been performing well recently, helping to offset losses on stocks and REITs. Unfortunately, our data only goes back to 1994, but several major events have happened in the bond market and emerging market since then. Emerging market bonds worst periods were 1994, 1998 and 2008 when drawdowns were 20-30%. Those are steep losses for bonds, but only took 8-15 months to recover.
The last asset class we use is real estate investment trusts (REITs). Since 1998 drawdowns of 15% of more have occurred in 15% of the months. The current drawdown is -16.5%.
Could the drawdowns get worse?
While the drawdowns could get worse on their own, there is one thing that would definitely make them worse – high fees! All of the returns provided above are for the market index, not for an ETF or mutual fund. When you add fees, the drawdowns get worse.
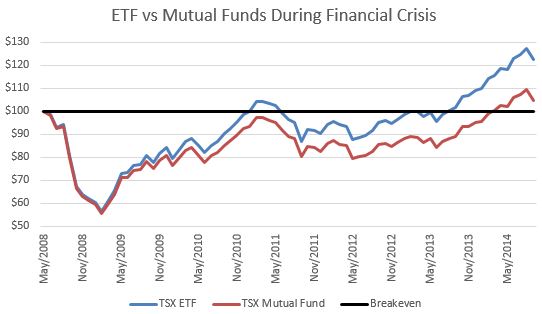
The TSX’s 2008 drawdown lasted almost 3 years (June 2008 to January 2011). If you had invested $100 in a Canadian equity ETF with an annual fee of 0.05% on June 1, 2008, by the end of January 2011 you would be back to $100. But if instead you invested $100 in a Canadian equity mutual fund with a fee of 2.5%, you wouldn’t have gotten back to $100 until March 2014! By that time, the $100 in the ETF would have been worth $116.
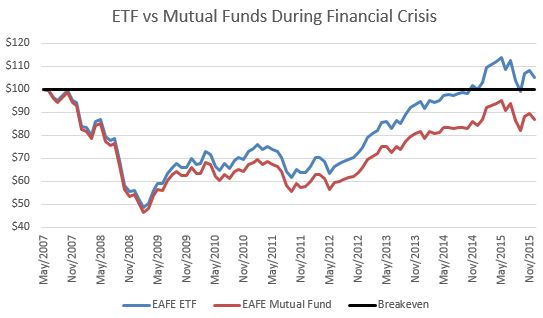
Things get even worse for international stocks as measured by the MSCI EAFE Index. If you had invested $100 in an ETF with annual fees of 0.25% on June 1, 2007 you would have been back to $100 in November 2014. If instead you had invested $100 in a mutual fund with an annual fee of 2.5% on that date, you still wouldn’t be back to $100 as of January 2016.
Sell your mutual funds to recover faster
Keeping fees low can make a huge difference in your investing experience, especially in difficult markets like today. Losing an additional 2+ percent per year in fees while trying to dig yourself out of a hole is like swimming with one arm tied behind your back. While no one likes to sell at a loss, a Canadian stock mutual fund is going to have the same holdings as a Canadian stock ETF. The same goes for most asset classes. So you are basically selling a mutual fund and buying back the same investments but in a different, lower cost format.
If you’re looking at losses on mutual funds right now, request a free, no obligation Mutual Fund Fee Report where we show you how much you could save by switching to a ModernAdvisor account.