September was another negative month for most global equity markets, with the exception of the US.
September 2018 Market Performance
All index returns are total return (includes reinvestment of dividends) and are in Canadian Dollars unless noted.
| Other Market Data | Month-end Value | Return for September 2018 | YTD 2018 return |
|---|---|---|---|
| Oil Price (USD) | $73.49 | +5.29% | +21.63% |
| Gold Price (USD) | $1,194.50 | -0.48% | -8.77% |
| US 3 month T-bill | +2.19% | +0.08%* | +0.80%* |
| US 10 year Bond | +3.05% | +0.19%* | +0.65%* |
| USD/CAD FX rate | 1.2945 | -0.84% | +3.19% |
| EUR/CAD FX rate | 1.5020 | -0.96% | -0.21% |
| CBOE Volatility Index (VIX) | 12.12 | -5.75% | +9.78% |
*Absolute change in yield, not the return from holding the security.
The S&P/TSX Composite was down -0.9% in September, and is now up +1.4% for 2018. In the US, the S&P500 was up +0.6%, while the Russell 2000 (an index of small cap stocks) was down -2.5%. European stocks were up +0.3%, German Stocks were down -0.9% and British stocks were up +1.0%, all remain in negative territory for 2018. While US stocks were positive, Japanese stocks was the bright spot at +5.5%. Emerging market stocks were down -1.4% in local currency and are down -4.8% YTD. REITs were also down, -0.3%, bringing the YTD to +9.8%.
On the bond side, the broad index of Canadian bonds, FTSE TMX Universe Bond Index was down -1.0%, and the FTSE TMX Short Term Bond Index was down -0.2%. Investment grade US bonds, as measured by the Merrill Lynch indexes, were also down. US and Canadian high yield bonds were up as were emerging market bonds.
Oil had a great month at +5.3% and is now up +21.6% for 2018. Gold was down -0.5%, its 7th negative month in 2018. The broad Bloomberg Commodity Index was up +1.7% in September but is still down -3.4% for 2018.
The Canadian Dollar strengthened in September, gaining +0.8% against the US Dollar and +1.0% against the Euro.
Commentary
With stock markets around the world, except the US, not providing much in the way of positive performance many investors are worried about their portfolios. Sorry to say I don’t have a magic solution for them other than patience.
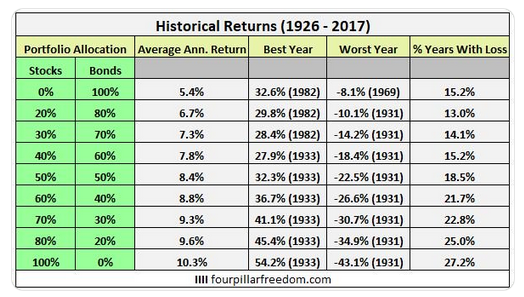
Vanguard crunched the numbers on how basic stock and bond allocations have performed over the past 92 years. While these are US market focused numbers, they provide some insight into what to expect from diversified portfolios for Canadians as well.
The commonly discussed 60/40 portfolio was negative in slightly more than 1 out of 5 calendar years. Even the most conservative portfolio that is 100% bonds was negative in 15% of the calendar years. If you’re expecting your portfolio to be up every month or quarter, this is a bit of a reality check. Diversified portfolios can be down for a year (or longer) with regularity.
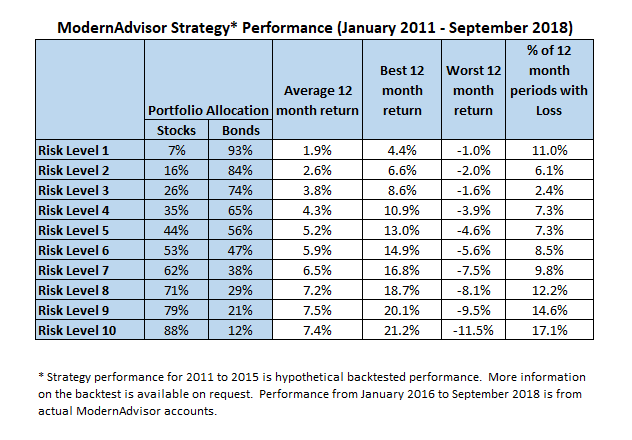
At ModernAdvisor we don’t have 92 years of performance history, so instead we looked at rolling 12 month periods. When including our backtested performance for 2011 to 2015, that gives us 82 observations to work with.
As you can see, like with the Vanguard study in the US, none of our diversified portfolios were positive 100% of the time. In the worst case, our risk level 10 portfolios had a loss in 17% of the 12 month periods, with -11.5% being the worst 12 month period. Conversely, the best 12 month return was more than double that. All of the risk levels have a similar pattern: the best 12 month returns were much, much better than the worst 12 month returns.
The last 12 months have been a reality check for many investors expecting their portfolio or account to be up every month or quarter. For a diversified portfolio that includes Canadian and international stocks and bonds that isn’t a realistic expectation. In our review of the various ETFs we use, I would expect all of our portfolios to be negative in at least 1 out of every 5 months, or at worst 1 out of every 3 months for the highest risk portfolios. But with the average monthly gain exceeding the average monthly loss, over the long term, your performance will be comfortably positive if you have patience to ride out the negative periods.
September 2018 Economic Indicator Recap
Below are the current readings on the major economic indicators: central bank interest rates, inflation, GDP and unemployment.
Below are the current readings on a few other often followed economic indicators: retail sales and housing market metrics.
A Closer Look at the Canadian Economy
Canada’s unemployment rate climbed to 6.0% in August. 92,000 part-time jobs were lost (erasing the 82,000 gained in the previous month) while 40,400 28,000 full time jobs were added, for a net loss of 51,600 jobs. Ontario saw job losses, Alberta and Manitoba saw gains and the other provinces were little changed.
Housing prices across Canada were up +0.2% in August with gains posted in 8 of 11 metropolitan areas. The largest gainers were Ottawa (+1.4%), Hamilton (+1.4%), and Montreal (+1.2%). Halifax, Vancouver and Calgary were the only decliners at -0.6%, -0.4%, and -0.3%, respectively.
The level of new housing starts declined -2.3% in August to 201K, while the value of building permits remained steady at $8.2 billion in July.
The inflation rate for August was -0.1%, and +2.8% on an annual basis. All eight components of the inflation calculation rose, with transportation the largest contributor. Core inflation which excludes more variable items such as gasoline, natural gas, fruit & vegetables and mortgage interest was +1.7%.
Retail sales were up +0.3% in July; compared to a year ago, retail sales were up +3.7%. Sales were up at food, beverage and liquor stores, gasoline stations, and electronics and appliance stores. Car dealers were one of the few sectors that experienced declines.
Canada’s GDP growth was up +0.2% for July. The goods-producing sectors gained +0.3%, as gains in manufacturing and utilities offset declines in construction, mining, and oil & gas. The services industries gained +0.2%, led by wholesale trade, transportation, and real estate services.
The Bank of Canada left interest rates unchanged at 1.5% at their September 5th meeting. With the NAFTA situation seemingly resolved the BoC is expected to raise interest rates at their October meeting.
*Sources: MSCI, FTSE, Morningstar Direct, Trading Economics


