
May was another good month for the equity markets, while fixed income recovered a little of the losses from the first quarter.
May 2021 Market Performance
All index returns are total return (includes reinvestment of dividends) and are in Canadian Dollars unless noted.
| Other Market Data | Month-end Value | Return for May 2021 | 2021 YTD Return |
|---|---|---|---|
| Oil Price (USD) | $66.96 | +5.48% | +38.00% |
| Gold Price (USD) | $1,911.15 | +8.06% | +0.85% |
| US 3 month T-bill | +0.01% | 0.00%* | -0.08%* |
| US 10 year Bond | +1.58% | -0.07%* | +0.65%* |
| USD/CAD FX rate | 1.2072 | -1.73% | -5.18% |
| EUR/CAD FX rate | 1.4749 | -0.33% | -5.50% |
| CBOE Volatility Index (VIX) | 16.76 | -9.94% | -26.33% |
*Absolute change in yield, not the return from holding the security.
May was another good month for the equity markets, while fixed income recovered a little of the losses from the first quarter.
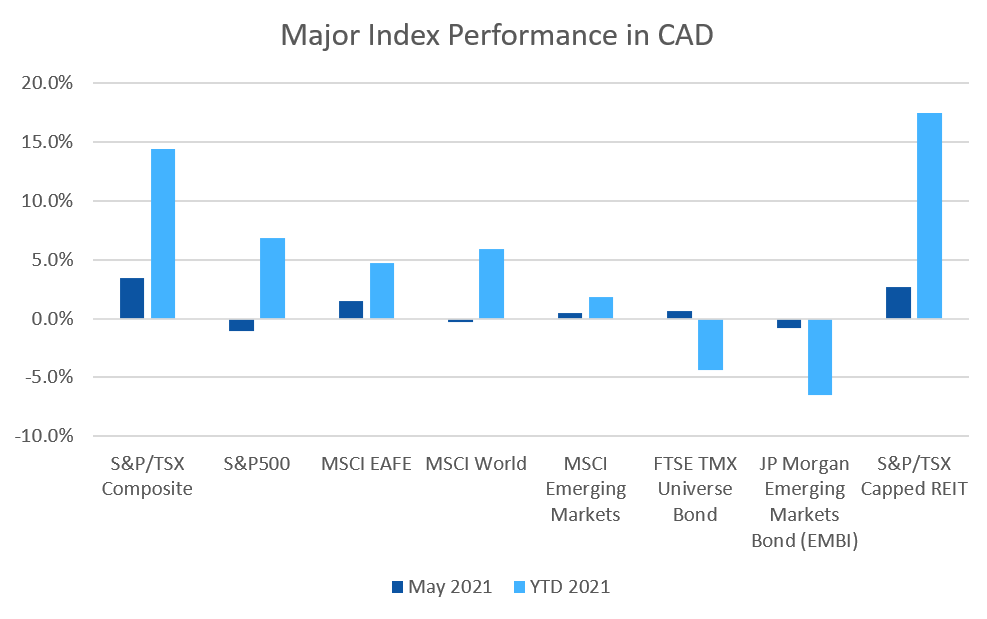
The S&P/TSX Composite was up +3.4% in May, hitting new all time highs. The TSX Comp. is now up more than +14% for 2021. The S&P/TSX Small Cap was up +4.1% for the month, and is up +18% for 2021. In the US, equity market performance was more subdued as tech stocks declined. The large cap S&P500 was up +0.7% (+12.6% for 2021) while the small cap Russell 2000 index was up +0.1% for May and +14.9% for 2021. The tech focused Nasdaq was down -1.5% for May, and is up +6.7% for 2021.
The broad index of EAFE (Europe, Australasia & Far East) stocks was up +1.7% (+9.8% for 2021), European stocks were up +1.9%, and British stocks were up +0.8% for May. For 2021 European and British stocks are up +11.1% and +8.7%, respectively. Japanese stocks were again one of the few laggards, gaining +0.2%. Emerging market stocks were up +1.2% for the month, and are one of the laggards for 2021, up +6.4%.
Bonds were up in May. The major Canadian bond index, the FTSE/TMX Universe Bond Index, gained +0.6% in May while the FTSE/TMX Short-term Bond Index was up +0.1%. US investment grade bonds performed similarly; the ICE BoA AAA and BBB indexes were up +0.6% and +0.8% respectively for May. High yield was up +0.3% for HY Master II and +0.5% for the CCC and lower Index (the real junky stuff). Emerging market bonds were down -0.8%.
REITs had another good month, gaining +2.7% in May and are up +17.4% for 2021.
Oil had a strong month, gaining +5.5% in May. For 2021 oil is now up +38.0%. Gold was up +8.1%, and is now positive for 2021, up +0.9% for the year. With oil making up a large part of the diversified Bloomberg Commodities Index, it gained +2.7% for May and is up +18.9% in 2021.
In May, the Canadian Dollar (CAD) gained +1.7% against the US Dollar, rising above 1.21 to the US Dollar, levels not seen since September 2017. Against the Euro, CAD gained +0.3%, and +5.5% for 2021.
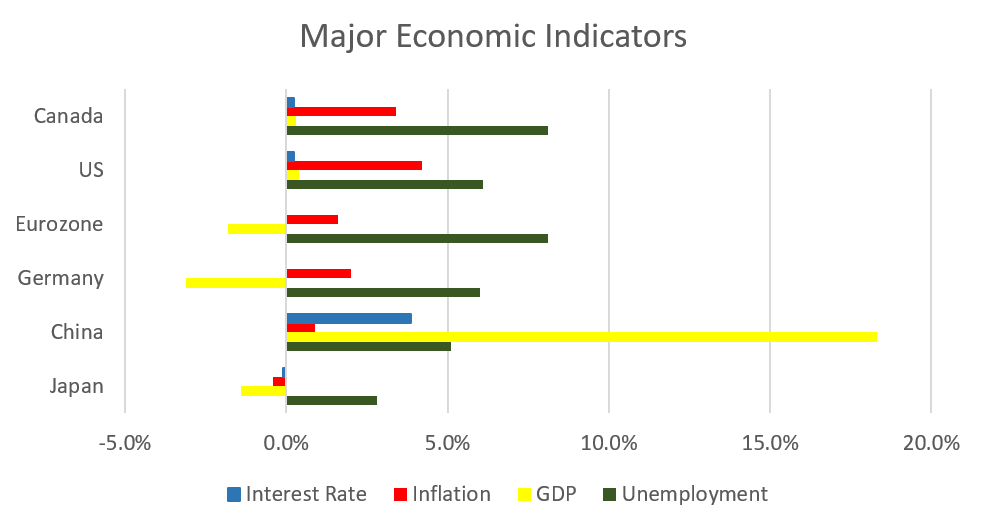
May 2021 Economic Indicator Recap
Below are the readings received in May for the major economic indicators: central bank interest rates, inflation, GDP and unemployment.
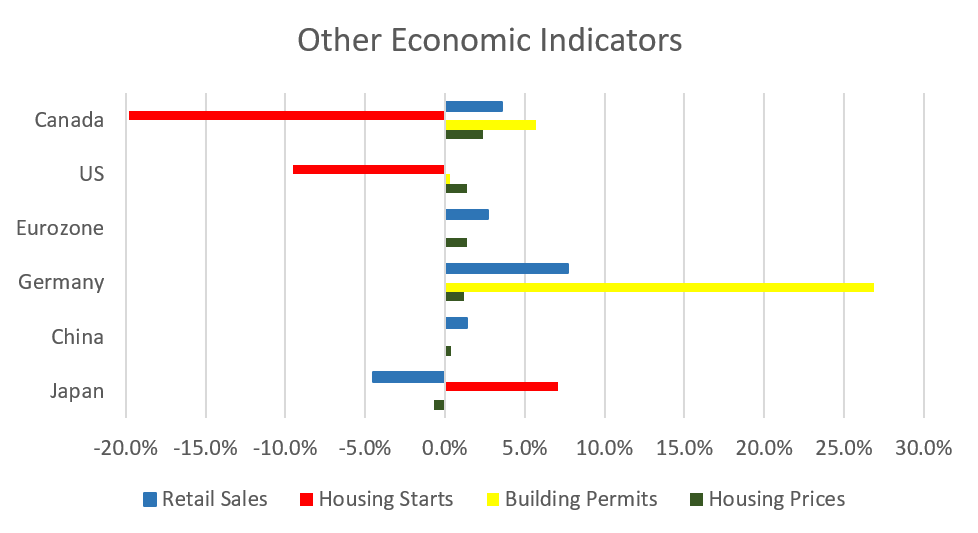
Below are the current readings on a few other often followed economic indicators: retail sales and housing market metrics.
A Closer Look at the Canadian Economy
Canada’s unemployment rate climbed to 8.1% in April, driven by an increase in people looking for work and those on temporary layoffs. The economy lost 207,100 jobs during the month as pandemic restrictions were tightened in several provinces; 129,400 were full time jobs and 77,700 were part time jobs.
Housing prices across Canada were up +2.4% in April, and +11.9% versus a year ago. Halifax was the top performer or the third month in a row, gaining +5.4%, followed by Toronto (+3.0%), Victoria (+2.8%) and Ottawa (+2.8%). For the second consecutive month all 11 major markets were positive.
The level of new housing starts dropped -19.8% to 268,600 in April, below forecasts of 280,000. Urban housing starts dropped -16.9%. Building permits rose +5.7% to a new all-time high $10.9 billion, as a boom in residential construction continued: +15.9% increase to a record $8.1 billion. Meanwhile non-residential construction slipped -15.6% to $2.8 billion.
The inflation rate for April was +0.5%, and +3.4% on an annual basis. Core inflation which excludes more variable items such as gasoline, natural gas, fruit & vegetables and mortgage interest was +2.3%. The annual inflation rate was the highest reading since May 2011. The rise in inflation was attributed mostly to higher gasoline prices (+62%), and the homeowners replacement cost index (+9.1%), the largest increase since April 1989 as higher building costs and demand for single-family homes continued to surge.
Retail sales were up +3.6% in March, led by higher sales at building material and garden suppliers, as well as clothing stores. The only decline reported was at food and beverage stores. Compared to a year ago, retail sales were up +23.7%.
Canada’s GDP was up +1.1% in March, the eleventh consecutive monthly gain since the biggest contraction on record in March and April of 2020. Collectively the goods sector and services sectors both rose +1.1%. 18 of 20 industrial sectors posted gains for the month. Early estimates for April suggest a contraction reflecting increased COVID-19 measures in some provinces.
As expected, the Bank of Canada left its benchmark interest rate at 0.25% at the April 21st meeting. The benchmark interest rate is expected to remain at its current low level until into 2022. The BoC reduced quantitative easing program of purchasing at least $4 billion of government and corporate bonds per week to $3 billion per week. The next meeting is scheduled for June 9.
*Sources: MSCI, FTSE, Morningstar Direct, Trading Economics