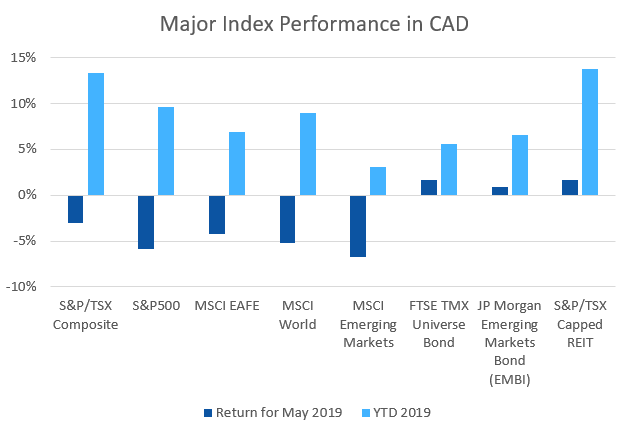
May saw most equity markets give back some of their gains from the previous few months. REITs and bonds helped to offset some of those losses.
May 2019 Market Performance
All index returns are total return (includes reinvestment of dividends) and are in Canadian Dollars unless noted.
| Other Market Data | Month-end Value | Return for May 2019 | 2019 YTD return |
|---|---|---|---|
| Oil Price (USD) | $53.50 | -16.29% | +17.82% |
| Gold Price (USD) | $1,305.80 | +1.62% | +1.91% |
| US 3 month T-bill | +2.35% | -0.08%* | -0.10%* |
| US 10 year Bond | +2.14% | -0.37%* | -0.55%* |
| USD/CAD FX rate | 1.3527 | +0.77% | -0.84% |
| EUR/CAD FX rate | 1.5098 | +0.29% | -3.30% |
| CBOE Volatility Index (VIX) | 18.71 | +42.61% | -26.40% |
*Absolute change in yield, not the return from holding the security.
May was a reminder for those that forgot about last December, that markets go down as well as up. The S&P/TSX Composite was down -3.1% in May, bringing the YTD down to +13.4%.
US markets were harder hit with the large cap S&P500 down -6.4%, while the small cap Russell 2000 was -8.0%. The S&P500 and Russell 2000 are still up +10.7% and +8.7% for 2019, respectively.
EAFE (Europe, Australasia & Far East) stocks were down -5.3% in May, was were European stocks. British stocks fared a little better for the month at -3.5%.
Emerging market stocks were one of the worst performers at -6.9%, along with Japanese stocks at -7.4%. Emerging market stocks remain up +4.5% for 2019.
Bonds were one of the bright spots in May. Canadian bonds performed well, with the FTSE/TMX Universe Bond Index up +1.7% and the FTSE/TMX Short-term Bond index up +0.5%. They are up +5.6% and +2.5% for 2019, respectively. US bonds were also positive in May, the best performer was the ML US Corporates AAA at +2.8%.
Emerging market bonds had their 7th positive month in a row, up +0.9% for May and +6.6% for 2019. REITs were also positive in May at +1.7%, and are now up +13.8% for 2019.
After four great months, oil was down -16.3% in May. Despite that, oil is still up +17.8% for 2019. Gold was up +1.6% for May (+1.9% for 2019) and the diversified Bloomberg Commodities Index down -3.6% for the month.
The Canadian Dollar (CAD) lost -0.8% in May against the US Dollar and -0.3% against the Euro.
Commentary – by Gordon Ross, CFA
The back and forth trade announcements from both China and the U.S. recently, are widely named as the cause of equity market corrections around the world in May.
While the changes in direction seem abrupt, surely no one can be surprised that neither country has settled easily. Some cause for surprise comes from Moody’s Analytics though. It indicates that North American real GDP growth will suffer more than China’s from a trade war, based on year-ago U.S. trade policy.
Trade wars are rarely good for anyone. Tariffs influence economic growth in a way parallel to the effect of friction on a machine.
Bond markets around the world were supported by assets moving from world equity markets. This is a healthy and normal rotation, and is a primary reason why all ModernAdvisor portfolios have appropriate allocations to bonds.
Canada has had its own trade issues with the U.S. About 30% of the revenues to Canada’s biggest companies still comes from those companies’ U.S. exposure.
Separate out Canadian companies with higher than average revenues from outside Canada; since late 2017 those companies have raised the return of our stock market above what it would have been without them. Over the same period, companies with higher than average revenues from within Canada, have lowered those returns.
No one knows whether a decline like the one in May, will develop into something more. There are reasonable and believable stories indicating both directions. Whenever something like this happens, it can feel like this time things can only become worse. The reality is that you don’t have to worry about that. If you stick with your sensible plan, focused on your objectives, and if your investments follow evidence rather than stories, you will meet your needs.
Many Canadians need or want to delegate management of their investments. If this feels like you, having a sensible, evidence-based plan is very important.
May 2019 Economic Indicator Recap
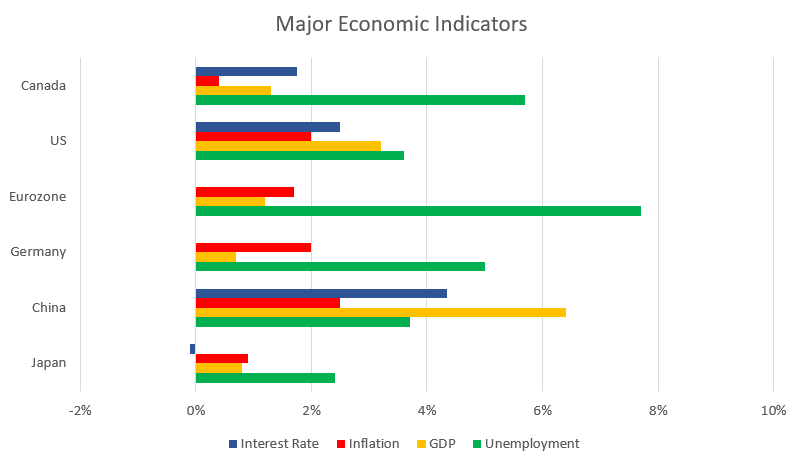
Below are the current readings on the major economic indicators: central bank interest rates, inflation, GDP and unemployment.
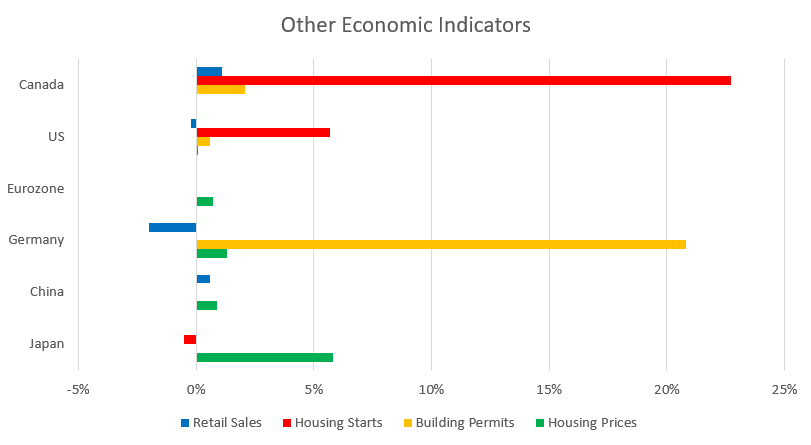
Below are the current readings on a few other often followed economic indicators: retail sales and housing market metrics.
A Closer Look at the Canadian Economy
Canada’s unemployment rate declined slightly to 5.7% in April with 106,500 new jobs added, the strongest employment gain on record. 73,000 were full time and 33,600 were part time jobs. Most of the gains came from Ontario, Quebec and Alberta.
Housing prices across Canada were flat in April, the eighth consecutive month with no gain. 6 of 11 metropolitan markets were down with Winnipeg (-2.0%), Halifax (-1.1%), Vancouver (-0.4%), and Quebec City (-0.4%) were the worst decliners. Ottawa (+0.9%), and Hamilton (+0.8%) were the largest gainers.
The level of new housing starts rose 22.7% in April to 235,500 units. The value of building permits issued in March rose 2.1% to $8.1 billion in March; the growth came solely from commercial construction as residential construction declined. .
The inflation rate for April was +0.4%, and +2.0% on an annual basis. Core inflation which excludes more variable items such as gasoline, natural gas, fruit & vegetables and mortgage interest was +1.9%.
Retail sales rose +1.1% in March; compared to a year ago retail sales were up +2.6%. Sales rose at gas stations (due to higher prices), clothing stores, and building material and garden stores. Sales fell at new and used car dealers.
Canada’s GDP rose +0.5% in March, the largest monthly gain since November 2017. Manufacturing, mining, quarrying & oil & gas, finance & insurance, and transportation all rose.
As expected the Bank of Canada left its benchmark interest unchanged at 1.75% at its May 29th meeting.
*Sources: MSCI, FTSE, Morningstar Direct, Trading Economics


