June saw most equity markets rebound from their May declines. Despite the volatility, most equity markets remain up double digits for 2019.
June 2019 Market Performance
All index returns are total return (includes reinvestment of dividends) and are in Canadian Dollars unless noted.
| Other Market Data | Month-end Value | Return for June 2019 | 2019 YTD return |
|---|---|---|---|
| Oil Price (USD) | $58.47 | +9.29% | +28.76% |
| Gold Price (USD) | $1,395.05 | +6.83% | +8.88% |
| US 3 month T-bill | +2.12% | -0.23%* | -0.33%* |
| US 10 year Bond | +2.00% | -0.14%* | -0.69%* |
| USD/CAD FX rate | 1.3087 | -3.25% | -4.07% |
| EUR/CAD FX rate | 1.4887 | -1.40% | -4.65% |
| CBOE Volatility Index (VIX) | 15.08 | -19.40% | -40.68% |
*Absolute change in yield, not the return from holding the security.
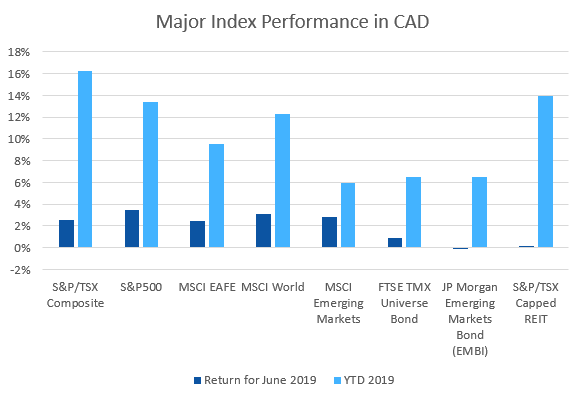
June saw most equity markets bounce back from the losses in May. The S&P/TSX Composite was up +2.5% for the month, bringing the return for the first half of the year to +16.2%.
US markets which were hard hit in May, performed well in June. The large cap S&P500 was up +7.0% (in USD), as was the Russell 2000. The S&P500 and Russell 2000 are up +18.5% and +16.2%, respectively for 2019.
EAFE (Europe, Australasia & Far East) stocks were up +4.1% in June, European stocks were up +4.4%. EAFE and European stocks are up +11.4% and +13.5%, for 2019 respectively. Despite the continued uncertainty around Brexit, British stocks remain up +10.4% for 2019.
Emerging market stocks are one of the laggards in 2019, at +8.7%, along with Japanese stocks at +6.3%.
Bonds performed reasonably well in June. Canadian bonds performed well, with the FTSE/TMX Universe Bond Index up +0.9% and the FTSE/TMX Short-term Bond index up +0.1%. They are up +6.5% and +2.7% for 2019, respectively. US bonds performed well in June, the best performer was again the ML US Corporates AAA at +2.5%.
Emerging market bonds were flat in June and are up +6.5% for 2019. REITs were up slightly in June at +0.2%, and are now up +14.0% for 2019.
After a double digit loss in May, oil was up +9.3% in June. Oil is up +28.8% for 2019. Gold also had a good month at +6.8%. The diversified Bloomberg Commodities Index was up +2.5% in June, and a relatively underwhelming +3.8% for the first half of 2019.
The Canadian Dollar (CAD) gained +3.3% against the US Dollar on expectations of a US interest rate cut. Against the Euro, CAD gained +1.4% in June.
Commentary – by Gordon Ross, CFA
For over a year, trade tensions between China and the U.S. have been widely accepted as one of the biggest risks to global economies and markets. This assessment is based on the best analysis by the best-informed sources. Many investor decisions were influenced by this perception of risk.
Then Presidents Trump and Xi met at the G20 Summit in the final days of June. Reports from both sides are positive in tone yet vague on details. Xi says, “China and the United States both benefit from cooperation and lose in confrontation.” Trump says, “We’re going to be strategic partners.”
Even one month ago, almost no one was predicting or betting that they would work out a compromise. Now that trade negotiations have resumed, what about the investment decisions prompted by those perceived risks?
Britain’s leaving the EU was supported three years ago by 52% of the voters in the referendum. Markets reacted dramatically. A broad consensus of economic studies is that Brexit is bad in any form. Brexit still has not happened and has just been postponed for at least six months. Will it ever happen? Three years ago, I saw no one predicting this or betting on it.
Making decisions based on news is not investing; it is speculating.
Earlier this year we commented in this blog on investment performance, “While December 2018 was the worst December in 25 years, January was the best January in 25 years.” Looking at calendar quarters for U.S. stocks: Q4 2018 they were down -14%, Q1 2019 they were up +13%, and Q2 2019 they were up almost +4%. They posted their best June since 1955.
Such volatility can cost anyone who tries to anticipate it. Making decisions based on recent performance is not investing; it is speculating. Investing success for you will come from basing your savings plan on long term evidence that serves your best interests. This is how ModernAdvisor helps you.
June 2019 Economic Indicator Recap
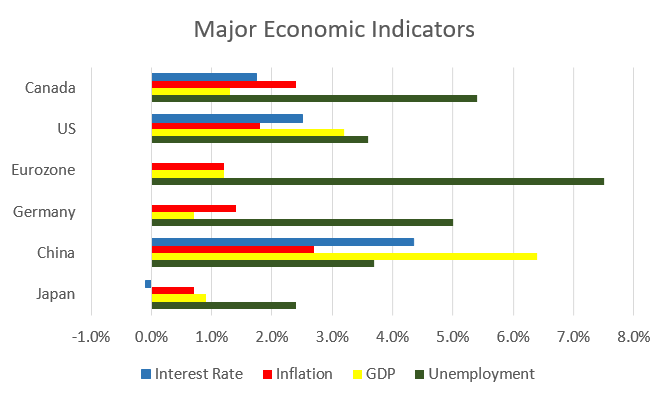
Below are the current readings on the major economic indicators: central bank interest rates, inflation, GDP and unemployment.
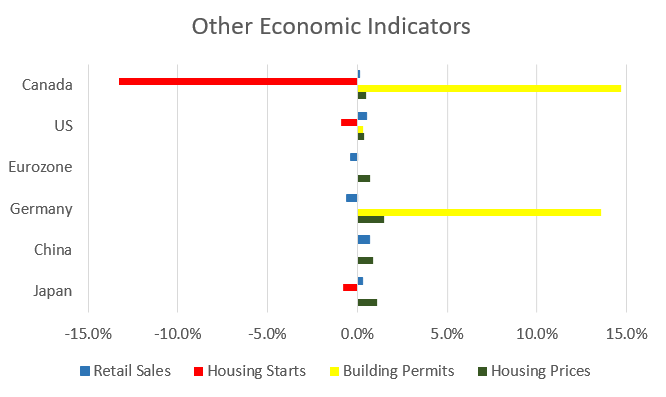
Below are the current readings on a few other often followed economic indicators: retail sales and housing market metrics.
A Closer Look at the Canadian Economy
Canada’s unemployment rate declined to 5.4% in May, the lowest since 1976. 27,700 new full time jobs were added, the part time jobs figures were flat. Ontario, BC and Nova Scotia showed the largest gains, while Newfoundland and PEI posted job losses.
Housing prices across Canada were up +0.5% in May, the first monthly gain in nine months. 9 of 11 metropolitan markets were up with Hamilton (+2.2%), Ottawa (+1.9%), and Halifax (+0.9%) the largest gainers. Edmonton and Vancouver were the only decliners at-0.3% and -0.2%, respectively.
The level of new housing starts declined -13.3% in May to 202,300 units. The value of building permits issued in April rose 14.7% to $9.3 billion; with most of the gain coming from BC.
The inflation rate for May was +0.4%, and +2.4% on an annual basis. Core inflation which excludes more variable items such as gasoline, natural gas, fruit & vegetables and mortgage interest was +2.1%.
Retail sales rose +0.1% in April; compared to a year ago retail sales were up +3.7%. Sales rose at gas stations, food and beverage stores, beer, wine and liquor stores, and specialty food stores. Sales fell at building material & garden equipment stores, and at clothing stores.
Canada’s GDP rose +0.3% in April, the largest monthly gain since November 2017. Mining, quarrying & oil & gas, construction, and wholesale trade all rose.
*Sources: MSCI, FTSE, Morningstar Direct, Trading Economics


