July was a quiet but positive month for most equity markets. The US Federal Reserve cut interest rates for the first time in over a decade which rattled markets at the end of the month.
July 2019 Market Performance
All index returns are total return (includes reinvestment of dividends) and are in Canadian Dollars unless noted.
| Other Market Data | Month-end Value | Return for July 2019 | 2019 YTD return |
|---|---|---|---|
| Oil Price (USD) | $58.58 | +0.19% | +29.00% |
| Gold Price (USD) | $1,437.80 | +3.06% | +12.21% |
| US 3 month T-bill | +2.08% | -0.04%* | -0.37%* |
| US 10 year Bond | +2.02% | +0.02%* | -0.67%* |
| USD/CAD FX rate | 1.3148 | +0.47% | -3.62% |
| EUR/CAD FX rate | 1.4627 | -1.75% | -6.32% |
| CBOE Volatility Index (VIX) | 16.12 | +6.90% | -36.59% |
*Absolute change in yield, not the return from holding the security.
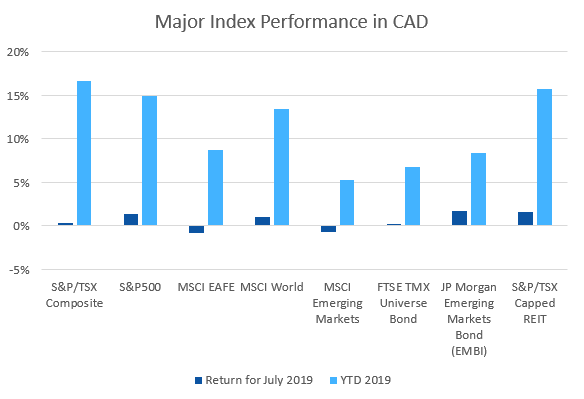
July was a quiet but positive month for most equity markets. The S&P/TSX Composite was up +0.3% for the month, and is now up +16.6% for 2019.
In the US, the large cap S&P500 was up +1.4% (in USD), and the Russell 2000 was up +0.5%. The S&P500 and Russell 2000 are up +20.2% and +16.8%, respectively for 2019.
EAFE (Europe, Australasia & Far East) stocks were up +0.7% in July, European stocks specifically were up +0.6%. EAFE and European stocks are up +12.2% and +14.2%, respectively. Despite the change in prime minister and continued uncertainty around Brexit, British stocks were up +2.2% and are up +12.8% for 2019.
Emerging market stocks were one of the downers in July at -1.5%, they remain up +7.1% for 2019.
Canadian bonds were basically flat in July, the FTSE/TMX Universe Bond Index was up +0.2% and the FTSE/TMX Short-term Bond Index was down -0.02%. They are up +6.7% and +2.7% for 2019, respectively. US bonds performed better in July, particularly the lower rated and high yield indexes.
Emerging market bonds performed well in July, the JPM EMBI (CAD) was up +1.7%; it’s up +8.3% for 2019. REITs also performed well at +1.6% for July and +15.8% for 2019.
Oil was roughly flat in July (+0.2%) while gold was up +3.1%. Oil is up +29.0% in 2019 and gold is up +12.2%. The diversified Bloomberg Commodities Index was down -0.9% in July and is up +2.9% for 2019.
The Canadian Dollar lost -0.5% against the US Dollar and gained +1.7% against the Euro in July.
Commentary – by Gordon Ross, CFA
July was a month of historic events, especially at the end.
It had been ten and a half years since the U.S. Central Bank last cut their benchmark interest rate, the second longest streak on record. Experts disagreed on whether the rate should change. Interest rates were low and near zero. Unemployment was low and not weakening. Inflation was low though many expected it to go higher. Uncertainty was high due to daily skirmishes in the trade “talks” between China and the U.S.
By the time the Federal Reserve acted, the quarter point cut was widely expected but some said the cut should have been larger. Others said the rate should not have been cut at all. In the press conference after the announcement, even the Chairman of the Fed himself had a different tone from his tone in the announcement itself.
Coincidentally about one year before the end of July, after its rise from the brink of bankruptcy in the late 90’s, Apple became the first publicly listed company to reach a $1 trillion market value. Can a person know when a recovery from the brink of bankruptcy will happen? A portfolio manager bought the stock nineteen years ago. It went down initially and then bounced around in a range. Almost three years after he bought it, his patience ran out and he sold it at a slight -5% loss. Should the portfolio manager have known?
Individual stocks can fly up and down a lot. Much of the time they lose a little or perform worse than the market. But a few pay off with a big return and are called “lottery stocks”. Poorly diversified portfolios can behave like this too. How can a reasonable person expect to trade on news events or recoveries from bankruptcy?
Decades of evidence show that a broadly diversified, balanced portfolio based on sound evidence reduces the lottery risks of which events will move markets or which stocks will give a big payoff. Time and patience compound this portfolio result.
July 2019 Economic Indicator Recap
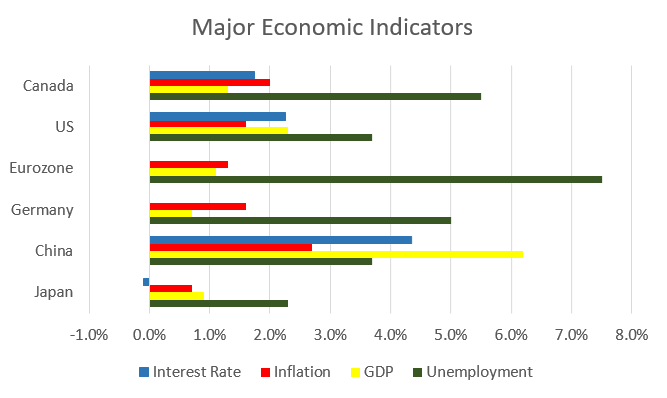
Below are the current readings on the major economic indicators: central bank interest rates, inflation, GDP and unemployment.
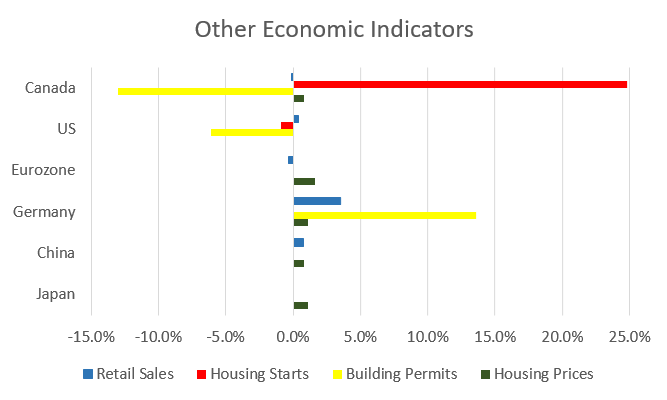
Below are the current readings on a few other often followed economic indicators: retail sales and housing market metrics.
A Closer Look at the Canadian Economy
Canada’s unemployment rate ticked up slightly to 5.5% in June, as 2,200 jobs were lost. 24,100 new full time jobs were added, while 26,200 part time jobs were lost. Alberta and Saskatchewan saw job gains, while Manitoba and Newfoundland experienced job losses, while the other provinces were flat.
Housing prices across Canada were up +0.8% in June, on the low side for June historically speaking. 8 of 11 metropolitan markets were up with Ottawa (+2.2%), Victoria (+2.1%), and Hamilton (+1.6%) the largest gainers. Calgary and Vancouver were the only decliners at -0.1% and -0.3%, respectively.
The level of new housing starts rose +24.8% in June to 245,700 units. The value of building permits issued in May declined -13.0% to $8.2 billion.
The inflation rate for June was -0.2%, and +2.0% on an annual basis. Core inflation which excludes more variable items such as gasoline, natural gas, fruit & vegetables and mortgage interest was +2.0%.
Retail sales declined -0.1% in May; compared to a year ago retail sales were up +1.0%. Sales declined -2.0% at food and beverage stores and -2.7% at clothing stores. Sales at gas stations rose +3.5%.
Canada’s GDP rose +0.2% in May. Manufacturing expanded +1.2%, construction gained +0.9%, while mining, quarrying & oil & gas contracted -0.8%.
As expected, the Bank of Canada left its benchmark interest rate unchanged at +1.75% at its July 10 meeting, as evidence is growing that trade tensions are having an effect on global economic activity.
*Sources: MSCI, FTSE, Morningstar Direct, Trading Economics


