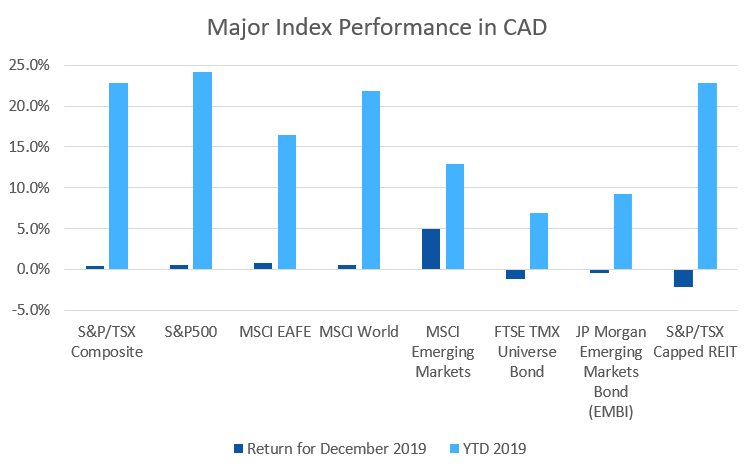
December was a good month for most equity markets, while one of the best performing asset classes in 2019, REITs, took a breather.
December 2019 Market Performance
All index returns are total return (includes reinvestment of dividends) and are in Canadian Dollars unless noted.
| Other Market Data | Month-end Value | Return for December 2019 | 2019 YTD return |
|---|---|---|---|
| Oil Price (USD) | $61.06 | +10.68% | +34.46% |
| Gold Price (USD) | $1,523.10 | +3.42% | +18.87% |
| US 3 month T-bill | +1.55% | -0.04%* | -0.90%* |
| US 10 year Bond | +1.92% | +0.14%* | -0.77%* |
| USD/CAD FX rate | 1.2988 | -2.27% | -4.79% |
| EUR/CAD FX rate | 1.4583 | -0.34% | -6.60% |
| CBOE Volatility Index (VIX) | 13.78 | +9.19% | -45.79% |
*Absolute change in yield, not the return from holding the security.
December was a good month for many of the major equity markets, with a few exceptions. The S&P/TSX Composite was marginally positive for the month at +0.5%, finishing 2019 at +22.9%, its best year since 2009. In the US, the large cap S&P500 was up +3.0% for December and +31.5% for 2019.
EAFE (Europe, Australasia & Far East) stocks were up +1.3% for the month and +18.1% for the year, their best year since 2013. European stocks specifically were up +1.6% for December and +20.0% for 2019. British stocks were a relative laggard for 2019, up +2.7% for December and +12.2% for the year. Emerging market stocks were up +5.5% in December and +15.1% in 2019.
Canadian bonds were down in December, the FTSE/TMX Universe Bond Index declined -1.2% and the FTSE/TMX Short-term Bond Index lost -0.1%. Both were positive for 2019; +6.9% and +3.1%, respectively. Investment grade US bonds were down for December, while speculative and high yield were positive. All were up more than +10% for 2019. Emerging market bonds were down -0.4% in December, but finished 2019 up +9.2%. REITs were also down in December, -2.2% but finished 2019 up +22.8%, their best year since 2011.
The headline commodities, oil and gold, were both up in December. Oil was up +10.7% and gold was up +3.4%. Oil was up +34.5% for 2019 and gold was up +18.9%. The diversified Bloomberg Commodities Index had a good December, up +4.9%, but it was only up +5.4% for 2019.
The Canadian Dollar (CAD) gained +2.3% against the US Dollar and +0.3% versus the Euro in December. CAD gained +4.8% and +6.6% against those currencies in 2019.
Commentary – by Gordon Ross, CFA
As each calendar year turns into the next, many of us look back at the past year to see where we stand. Most of us consider the year ahead and wonder where we might be going.
In the investment world, this often develops into explanations of performance earned, and forecasts of possible good and bad performance in the future. Yet every report of investment performance offers the small print, “past performance does not predict future results”.
There are two common biases in this performance gazing. These biases can be stated like this. “If it has performed well, then it is a good investment.” Or the other one, “If it has performed poorly, then stay away from it.” Which is correct? For investments, neither is correct.
This seems to be a natural human bias. If you flip a coin five times and it comes up heads every time, how are you going to bet? If it keeps changing, you feel uncertain with no way of knowing how to bet.
Getting specific, 2019 was a very good year for US stocks, in the top 10% of all years. The last five years of return is near, but above, the median of all five-year returns. The last fifteen years of return is certainly in the top 25% of all 15-year returns. Some people will make a strong case that we should expect more strong returns. Others will claim convincingly that this cannot continue, and we should expect a reversal.
Mark Hulbert, writing for MarketWatch shows that whether the US stock market is up or down in a year, has no value in predicting whether it will be up or down the following year. Even if US stocks are up or down a lot in a year, knowing that has no value in predicting whether they will be up or down at all in the following year.
Many advisors use long term averages to guess future returns. How often are actual returns close to long term averages? Very seldom it turns out. Even if you use very long-term averages, like 30 years, actual returns are only close to those about half the time. Market returns are always volatile and unpredictable.
Hulbert makes another valuable point. U.S. stocks are up about 67% of the time. Is that good or bad? That depends on your risk tolerance and circumstances. Those are good odds if your focus is making money next year. But if you are a retiree, a one in three chance of losing money may be unacceptable.
As always, focus on your personality, circumstances, objectives and constraints. ModernAdvisor helps you with that.
December 2019 Economic Indicator Recap
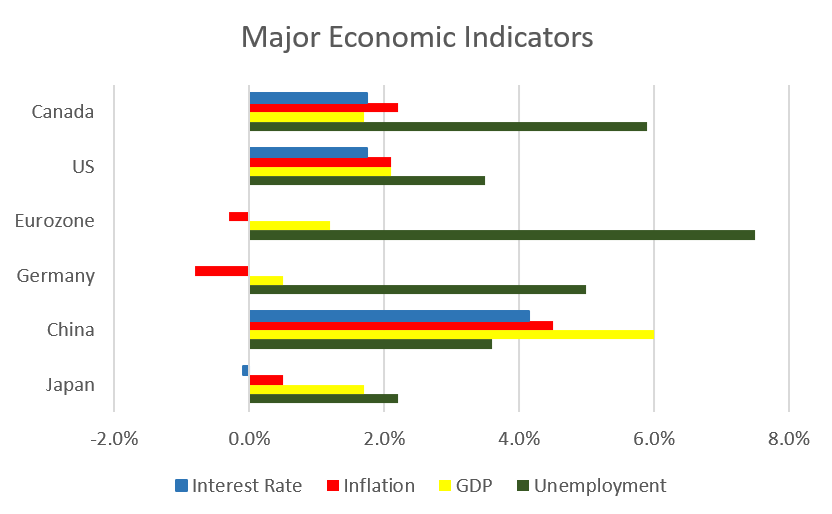
Below are the current readings on the major economic indicators: central bank interest rates, inflation, GDP and unemployment.
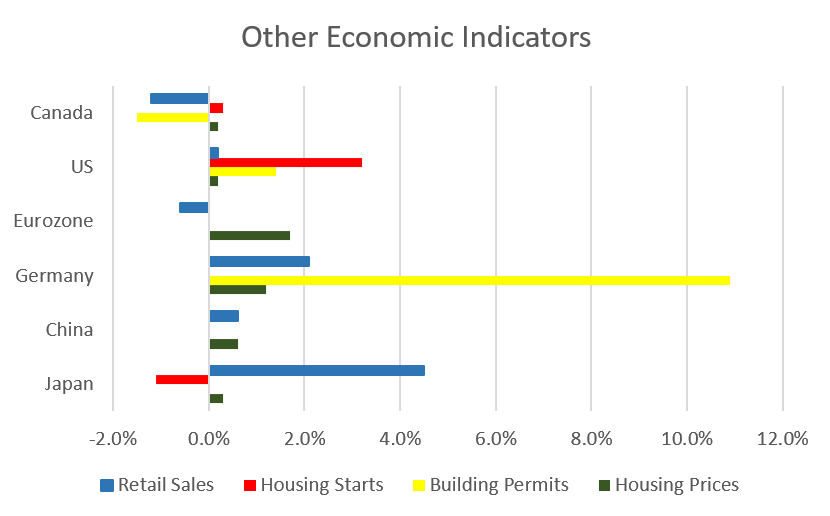
Below are the current readings on a few other often followed economic indicators: retail sales and housing market metrics.
A Closer Look at the Canadian Economy
Canada’s unemployment rate rose to 5.9% in November as 71,200 jobs were lost. 38,400 of those jobs lost were full time and 32,800 were part time.
Housing prices across Canada were up +0.2% in November. Quebec City was the top performer at +1.0%. The worst performers were Halifax (-1.3%) and Winnipeg (-0.6%).
The level of new housing starts rose +0.3% in November to 201,300 units. The value of building permits issued in October declined -1.5% to $8.3 billion. The value of residential building permits for single family homes declined -2.9% and multi-family permits declined -3.4%
The inflation rate for November was -0.1%, and +2.2% on an annual basis. Core inflation which excludes more variable items such as gasoline, natural gas, fruit & vegetables and mortgage interest was +1.9%. The increase in the annual inflation rate was driven largely by a rebound in energy prices.
Retail sales declined -1.2% in October; compared to a year ago retail sales were down -0.6%. Sales declined at new car dealers and used car dealers and at building and garden supply stores. Sales rose at gas stations due to a rise in gasoline prices.
Canada’s GDP declined -0.1% in October, the first decline in 8 months. Goods producing industries declined -0.5%, driven by a -1.4% decline in manufacturing. The services sector was flat.
As expected the Bank of Canada left its benchmark interest rate unchanged at their December 4 meeting. With inflation remaining tame, no changes are anticipated (if at all) until well into 2020.
*Sources: MSCI, FTSE, Morningstar Direct, Trading Economics


