Stock markets seemed to stabilize in February, giving some comfort to investors after a rocky few months. The Canadian dollar retreated quickly from its lows of 1.45 to the USD that were reached in the middle of January, while oil recovered to the mid $30 range.
February 2016 Market Performance
All index returns are total return (includes reinvestment of dividends) and are in Canadian Dollars unless noted.
| Other Market Data | Month-end Value | Return for February |
Return for 2016 |
| Oil Price (USD) | $33.75 | +0.39% | -11.42% |
| Gold Price (USD) | $1,234.40 | +10.57% | +16.43% |
| US 3 month T-bill | +0.33% | 0.00% | +0.17% |
| US 10 year Bond | +1.74% | -0.20% | -0.53% |
| USD/CAD FX rate | 1.3531 | -3.39% | -2.23% |
| EUR/CAD FX rate | 1.4721 | -2.98% | -2.05% |
| CBOE Volatility Index (VIX) | 20.55 | +1.73% | +12.85% |
*Absolute change in yield, not the return from holding the security.
Overall, equity markets were mixed in February. One of the big winners was Canadian small cap, which had been beaten up pretty badly in the last few months due to the drop in oil prices, was up +5.1%. The S&P500 was up slightly, the Nasdaq was down -1.2% and the Russell 2000 (a US small cap index) was down -0.1%. However with the rise in the Canadian Dollar, the returns on US markets were quite negative unless you were in hedged investments. European equities were generally negative in the -2% to -4% range in February, but the UK’s main index (FTSE100) was up +0.2%. The Nikkei was the one bad spot, down -8.5%.
Canadian government bonds performed reasonably well, up +0.1% to +0.5% depending on the sector, while most Canadian corporate bond indexes were negative. The broad FTSE/TMX Universe Bond Index was up +0.2%. Corporate bonds in the US performed better than their Canadian counterparts, while high yield was negative for the fourth month in a row. The most speculative credits, that is CCC rated bonds, dropped to levels not seen since the 2008 financial crisis. While that is not a good sign, higher rated credits are no where near their 2008 lows. As well, default rates remain low by historical standards and most companies are having little trouble in refinancing their debt as it comes due.
After several months of negative performance oil finished the month roughly where it started. Gold was the top performer in the commodities space, up +11.2%. Platinum and silver were also positive for the month. The big loser was natural gas, down -27.1%. That’s great news for homeowners (like me) that use natural gas to heat their homes and create hot water. Its not so great for the B.C. government that has been putting a lot of effort into building liquefied natural gas terminals on the north coast of the province. The broad Bloomberg Commodity Index was down -1.7% for February.
The Canadian Dollar strengthened in February against most major currencies, hitting 1.3531 to the US dollar, 1.4721 to the Euro, and 1.8834 to the British Pound. This recovery was very swift as in January the Canadian Dollar was below 1.40 to the USD, 1.50 to the Euro and 2.00 to the Pound.
Market Commentary
So did we reach the bottom? It certainly felt like that around the beginning of February, but “felt” is a pretty unscientific term and until we see some strong positive economic performance it is may be too soon to tell. At the very least, we are closer to the bottom than 6 months ago!
With that being said, you might be wondering if now is a good time to buy, especially with the just concluded 2015 RRSP season. If you have cash in your RRSP and an investment plan in place, then you should execute that plan and not wait until the market has risen 10% or 20%, or however much makes you feel comfortable. With foreign markets being the cheapest in years, many Canadians have been loading up on foreign stocks in record volumes. The most recent figures from Statistics Canada, showed that Canadians bought $9.68 billion worth of foreign, mostly non-US stocks and $7.7 billion of non-Canadian bonds in December 2015. That combined $16.45 billion was an all time record, which broke the all time record set the previous month.
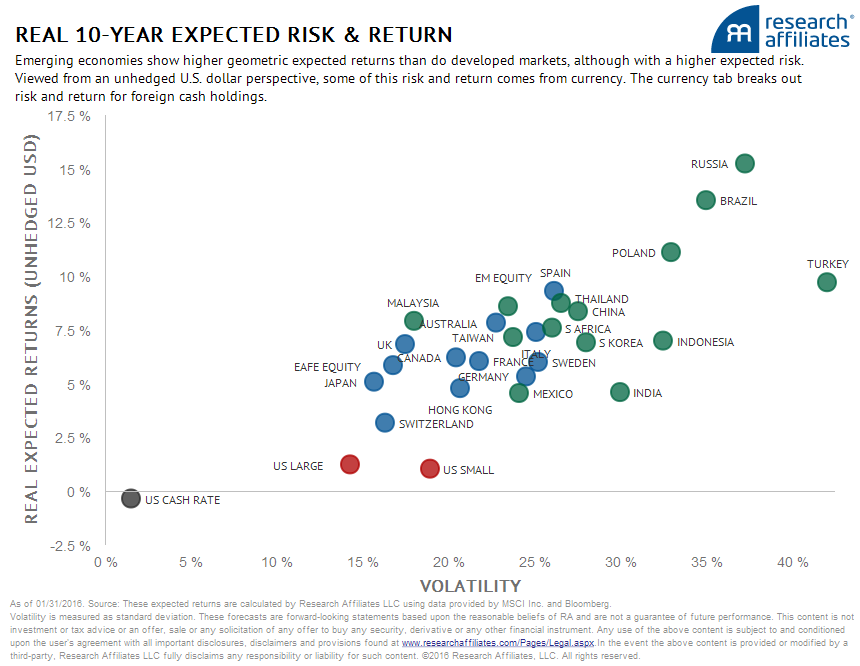
It seems that the poor performance of markets abroad hasn’t dissuaded Canadians from buying foreign investments. So what is behind this surge? Well, the valuations of stock markets around the world are quite attractive. Research Affiliates publishes their expectations of returns for stocks and bonds from around the world on a monthly basis now, and as you can see from the graph below, their expectations for returns outside the US are quite attractive.
A large part of the expected returns calculation is based on the country’s stock market returning to a more normal valuation. Countries like Russia, Brazil, India, China, parts of Europe and Canada are below their historical averages or are at all time lows in terms of valuations. The U.S. on the other hand, is valued at historically high levels. If you can stomach the volatility of Russian, Brazilian, Polish and Turkish stocks, by all means overweight those markets in search of double digit returns. Otherwise, look for a diversified basket of EAFE (Europe, Australasia and Far East) and emerging market stocks, like you find in an ETF.
So even if we have not already seen the bottom in many stock markets, the prices are quite attractive. Given where we are at now, it is likely that there is more upside than downside, making this a good time to start buying if you’ve been sitting on the sidelines.
Of course, if you have a financial/investment plan in place, and have completed your annual rebalancing or are about to, you have likely already been taking advantage of some pretty attractive investment opportunities in the stock markets and have had to sell some of your fixed income holdings to get back to your target weight. While you might be tempted to take a wait and see approach to buying equities right now, buying when valuations are low is the best way to “buy low” so that you can eventually “sell high”. Right now if you have to sell fixed income to get back to target, you are most likely “selling high” as there really isn’t much room for fixed income to go up.
February Economic Indicator Recap
Below are the current readings on the major economic indicators: central bank interest rates, inflation, GDP and unemployment.
Below are the current readings on a few other often followed economic indicators: retail sales and housing market metrics.
A Closer Look at the Canadian Economy
Canada’s unemployment rate ticked up 0.1% to 7.2% in January as 5,700 jobs were lost; 11,300 part time jobs were lost but 5,600 full time jobs were added.
Building permit activity rose 11.3% for the month of December. This is a very volatile metric with gains and losses of more than +/- 10% the norm. Housing starts, which were reported for January, were down -3.9% to 165,800, which is on the low side over the last few years. Housing prices were up again in December by +0.1%, or +1.6% over the last year.
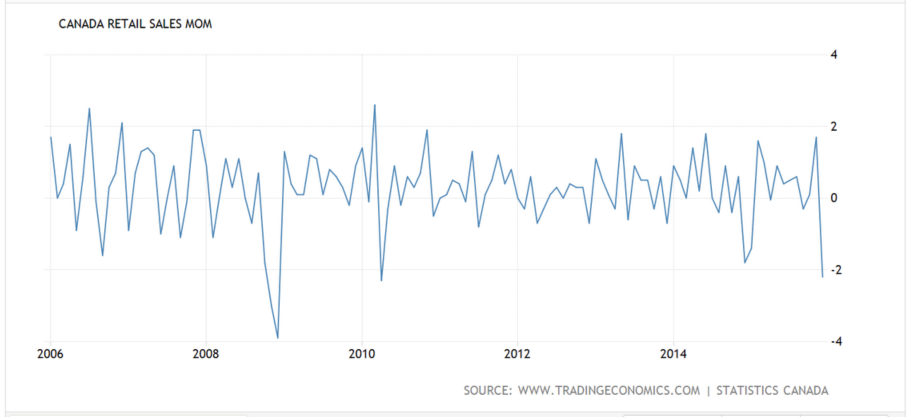
After a negative report in December, inflation returned to positive territory and was up +0.2% in January. On an annual basis, the inflation rate was +2.0%, in line with the Bank of Canada’s target rate. Core inflation which excludes more variable items such as gasoline, natural gas, fruit & vegetables and mortgage interest was also +2.0% for the last year. Retail sales in December declined -2.2% for the month, but were up +2.6% for the year. That monthly decline was the largest since the spring of 2010.
The December GDP report was positive at +0.2%, putting the growth rate for the last quarter of 2015 at +0.2%, better than many analysts had forecast. The Bank of Canada next meets on March 9 and is not expected to make a change to their benchmark interest rate.
*Sources: MSCI, FTSE, Morningstar Direct, Trading Economics


