March was the worst month for global stock markets since the 2008-09 financial crisis. Bonds were down a little, while oil halved (!) in price as COVID-19 shutdowns decimated the demand for oil.
March 2020 Market Performance
All index returns are total return (includes reinvestment of dividends) and are in Canadian Dollars unless noted.
| Other Market Data | Month-end Value | Return for March 2020 | 2020 YTD return |
|---|---|---|---|
| Oil Price (USD) | $20.48 | -54.24% | -66.46% |
| Gold Price (USD) | $1,596.60 | +1.91% | +4.83% |
| US 3 month T-bill | +0.11% | -1.16%* | -1.44%* |
| US 10 year Bond | +0.70% | -0.43%* | -1.22%* |
| USD/CAD FX rate | 1.4187 | +5.64% | +9.23% |
| EUR/CAD FX rate | 1.5584 | +5.54% | +6.86% |
| CBOE Volatility Index (VIX) | 53.54 | +33.48% | +288.53% |
*Absolute change in yield, not the return from holding the security.
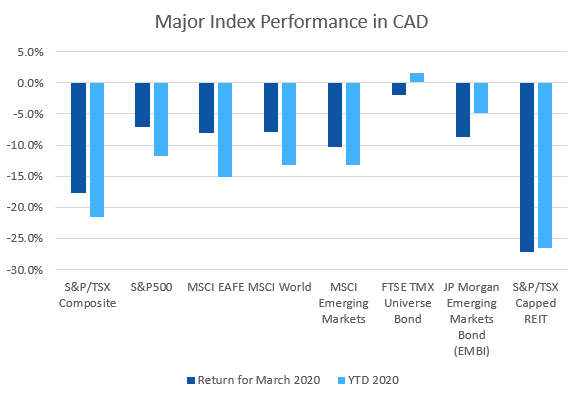
March was the worst month for global equity markets since the 2008-2009 financial crisis as the COVID-19 pandemic spread and the majority of the developed world went into self-isolation in an attempt to slow the spread of the virus.
The S&P/TSX Composite was down -17.4% for the month and -20.9% for the quarter. The S&P/TSX Small Cap Index was down -29.7% for the month and -38.6% for the quarter! In the US, the large cap S&P500 was down -12.3% and -19.6% for the quarter. The US’ main small cap index, the Russell 2000, was down -21.9% for the month and -30.9% for the quarter. Meanwhile the tech-heavy Nasdaq was “only“ down -10.1% in March and is down -14.2% for the first quarter.
EAFE (Europe, Australasia & Far East) stocks were down about the same as US stocks: -13.0% for March and -21.2% for the quarter. European and Japanese stocks posted about the same returns. British stocks fared a little worse at -13.8% for the month, and -24.8% for the quarter. Emerging market stocks also performed about the same as US and EAFE stocks; -13.2% for the month and -19.3% for the quarter.
Canadian bonds were mixed in March, the FTSE/TMX Universe Bond Index was down -2.0% in March and the FTSE/TMX Short-term Bond Index rose +0.1%. They are up +1.6% and +1.8% for the quarter, respectively. All of the Merrill Lynch US bond indexes we follow were down for March; the investment grade indexes were down between -1.3% to -10.3%, with returns worsening as you descend the credit rating table. The speculative and high yield US indexes fared worse: -13% to -20%. Emerging market bonds were down -8.6%. REITs were hit particularly hard, down -27.3% for March and -26.6% for the quarter.
Oil posted shocking performance in March, losing -54.2% which brought the performance for the quarter to -66.5% as demand completely disappeared. In April, oil futures for WTI Crude turned negative, implying that no one trading the futures contracts wanted to take delivery of crude oil in May since oil storage facilities were nearly full. Gold, often regarded as a safe haven in difficult times was only up +1.9% in March and +4.8% for the quarter. The diversified Bloomberg Commodities Index was down -13.1% for the month, and -23.8% for the quarter.
With the Canadian Dollar (CAD) being correlated to oil prices, unsurprisingly it lost ground to other major currencies in March. Against the US Dollar and Euro, CAD lost –5.6% and -5.5%, respectively.
Commentary – by Gordon Ross, CFA
With all the changes in the world and markets currently, it can be a difficult time for most of us. Coverage of these changes is a deluge and I hope the facts here will bring comfort. Some people were calling it a bear market before mid-March, and then calling it a new bull market a few weeks later. Some say we are in a recession before the economic data are even published. How can we make sense of this?
The Bank of Canada omitted its economic projections from its recently released quarterly Monetary Policy Report, saying that forecasting can’t be done “with any degree of confidence” because of the uncertainty from the COVID-19 pandemic. The Bank said, “The necessary efforts to contain the COVID-19 pandemic have caused a sudden and deep contraction in economic activity and employment worldwide.” They did not call it a recession. The Bank called this the “shutdown phase of the pandemic”.
Though there is economic fallout from the current crisis, its causes are not economic. The current crisis is an economic disruption more like an earthquake and the tsunami that sometimes follows. Pandemics are like earthquakes in that experts can say with high certainty that they will occur, but with extremely low certainty when they will occur. Predictions like that are not precise enough for us to guess when to prepare. The economic tsunamis that follow pandemics and earthquakes are parallels.
The best way for you to protect yourself from such events is to be prepared before they happen. For earthquakes and tsunamis that means plywood for doors and windows, and maybe sandbags. For pandemics and their investment fallout it means broadly diversified portfolios based on sound evidence, like the ones ModernAdvisor manages. The Investor Office of the Ontario Securities Commission offers three tips to deal with economic uncertainty: have a budget and follow it; have an emergency fund (your TFSA is perfect); take every opportunity to save and invest.
The terrible thing about crises is that they always happen. The wonderful thing about them is that they always end.
March 2020 Economic Indicator Recap
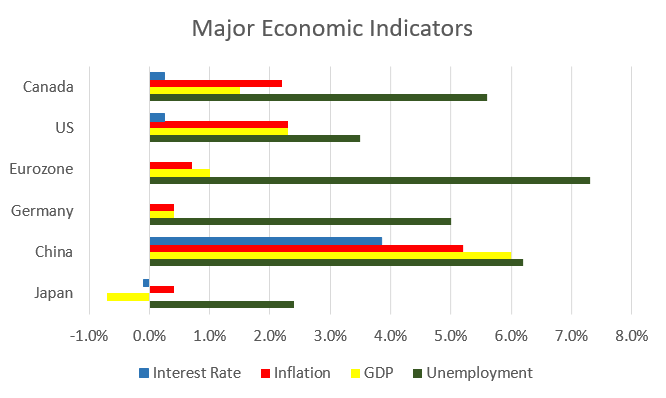
Below are the readings received in March for the major economic indicators: central bank interest rates, inflation, GDP and unemployment.
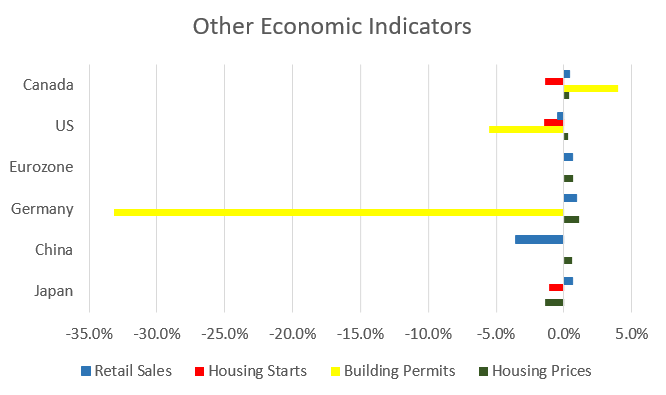
Below are the current readings on a few other often followed economic indicators: retail sales and housing market metrics.
A Closer Look at the Canadian Economy
Canada’s unemployment rate rose slightly to 5.6% in February as 30,300 jobs were added, beating expectations of 10,000. 37,600 of those jobs were full time, while 7,300 part time jobs were lost. The labour force participation rate rose 1.1%, accounting for the slight rise in the unemployment rate. Employment increased the most in Quebec, Alberta, Nova Scotia, and Manitoba.
Housing prices across Canada were up +0.4% in February, as 7 of the 11 major Canadian markets were up for the month. Montreal, Vancouver, and Halifax were the top performers at +1.1%, +0.8% and +0.8%, respectively. Edmonton and Calgary were the worst performers, -1.1% and -0.9%.
The level of new housing starts shrank -1.9% in February to 210,000 units, a decline less than expected. Urban starts declined -1.9% as multi-family starts dropped -6.1% and single family rose +11.9%. The value of building permits issued in January rose +4.0% to $9.2 billion. Residential permits rose +12.7% while non-residential construction declined -7.8%.
The inflation rate for February was +0.4%, and +2.2% on an annual basis. Core inflation which excludes more variable items such as gasoline, natural gas, fruit & vegetables and mortgage interest was +1.8%. The increase in the annual inflation rate was driven largely by food, housing, and clothing.
Retail sales were up +0.4% in February; compared to a year ago retail sales were up +3.4%. Higher sales were reported at new car dealers, general merchandise stores and gasoline stations. Sales declined at grocery stores and clothing stores. In general, retail sales in February were affected by rail blockades and the onset of the COVID-19 pandemic.
Canada’s GDP rose +0.1% in January; the services sector rose +0.1% and the goods producing sectors rose +0.2%. Transportation & warehousing, and air transportation were the largest decliners.
The Bank of Canada cut its benchmark interest rate by 0.5% on March 4, March 13, and again on March 27, bringing the rate to +0.25%, the lowest rate since the financial crisis. The BoC and many other central banks also launched quantitative easing programs to buy bonds and other securities to help ensure the financial markets continued to function.
*Sources: MSCI, FTSE, Morningstar Direct, Trading Economics


