September was another rough month for the markets. August’s volatility continued, Volkswagen dropped a bombshell and the US Federal Reserve once again declined to raise interest rates.
September 2015 Market Performance
All index returns are Total Return (includes reinvestment of dividends) and are in Canadian Dollars unless noted.
| Other Market Data | Month-end Value | Return for September |
2015 YTD Return |
| Oil Price (USD) | $45.09 | -8.35% | -15.36% |
| Gold Price (USD) | $1,115.20 | -1.53% | -5.82% |
| US 3 month T-bill | 0.00% | -0.08%* | -0.04%* |
| US 10 year Bond | +2.06% | -0.15%* | -0.11%* |
| USD/CAD FX rate | 1.3345 | +1.43% | +15.03% |
| EUR/CAD FX rate | 1.4914 | +1.02% | +6.24% |
| CBOE Volatility Index (VIX) | 24.50 | -13.82% | +27.60% |
*Absolute change in yield, not the return from holding the security.
All stock markets we track had a difficult month in September. The few stock indexes that were still positive for the year at the end of August are now negative as well, when measured in their local currency. The worst performers were Japan, down almost -8%, and Germany, down almost -6%.
When stock markets sell off, bond markets typically rise as investors flock to relative safety. In Canada most bond indexes were flat to slightly negative; the broad FTSE/TMX Universe Bond Index was down -0.3%. Outside of Canada bonds generally performed better. US high grade bonds did well, as did German bonds, while high yield bonds posted their 4th negative month in a row.
Commodities continued to slide with oil down more than -8% and gold down -1.5%. On the futures markets, orange juice was the worst performer down -18.5%. Most other commodities were down for the month; the broad Bloomberg Commodity Index was down -3.4%.
The Canadian Dollar continued to weaken in September, dropping below 1.33 to a US Dollar and 1.49 to a Euro.
Market Commentary
September was a rough month for investors. The volatility from August continued, albeit at less extreme levels. The US Federal Reserve left interest rates unchanged yet again, citing a potentially slowing global economy and market volatility. Volkswagen dropped an emissions-rigging bombshell on its TDI-loving followers and the stock lost a third of its value over 2 days. There really was little in the way of good news to be had in September.
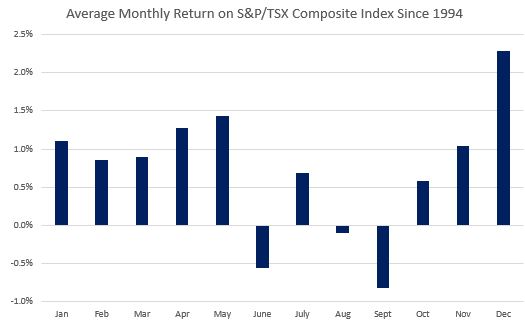
Historically, September is the S&P/TSX Composite Index’s worst month with an average return of -0.8% since 1994. It is also the worst month for the S&P500 when measured in Canadian Dollars. So if something bad is going to happen on the stock market, it generally happens in September.
For most of the month, investors around the world waited to see what the US Federal Reserve would do with interest rates. Despite the US economy and labour market showing continued strength, the US Federal Reserve left interest rates unchanged at their September meeting and specifically cited the higher volatility as one of the reasons why.
Meanwhile, Norway cut interest rates by 0.25% to 0.75% as the effect of lower oil prices continues to be felt. India cut interest rates by 0.50%.
When VW’s fellow German car makers were introducing new diesel engines that required a special additive to help meet emissions targets, I thought it was interesting that most of VW’s did not. What did their engineers know that BMW’s and Mercedes-Benz’s did not? Apparently it was how to use the engine computer to cheat on emissions tests! VW will survive; all of their luxury divisions that make gasoline powered cars (Porsche, Bentley, Lamborghini and Audi) have been having record years. VW-branded gasoline powered cars regularly win awards and are well liked by critics. Remember, unlike recent scandals at GM and Toyota, or the Takata air bag recall, no one has died. Full disclosure: at the time this was published I don’t own a VW product or VW shares.
September Economic Indicator Recap
Below are the current readings on the major economic indicators: central bank interest rates, inflation, GDP and unemployment.
Below are the current readings on a few other often followed economic indicators: retail sales and housing market metrics.
A Closer Look at the Canadian Economy
Canada’s unemployment rate rose in August to 7.0% from 6.8%. 54,400 full time jobs were added, while 42,400 part time jobs were lost. Despite 12,000 jobs being added, the unemployment rate rose as more people entered the labour force.
Housing starts in August came in at 216,900, a level not seen since 2012. Building permit activity in July was down slightly while housing prices were flat. Retail sales in July rose 0.5%, and were up 1.8% over the past 12 months.
Inflation remained stable in August at +1.3% year over year. Core inflation which excludes more variable items such as gasoline, natural gas, fruit & vegetables and mortgage interest eased slightly to 2.1%. The Bank of Canada’s inflation target is 2%, so it is unsurprising that they left interest rates unchanged at 0.50%.
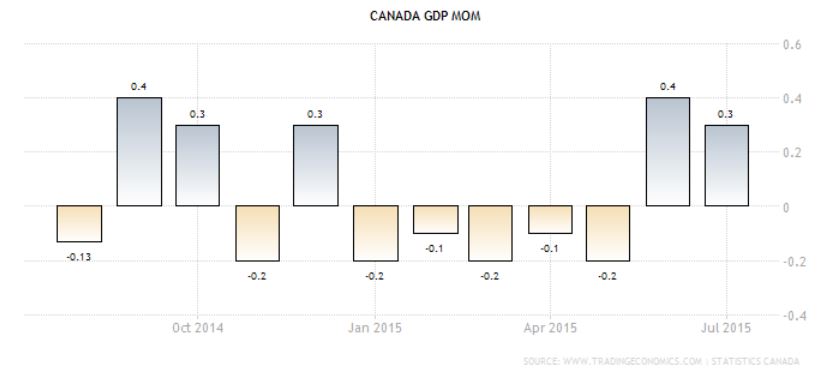
 GDP was positive for the second month in a row, with July coming in at +0.3%. June’s performance was revised down slightly to +0.4%. That doesn’t sound like much, but monthly GDP over +0.5% is fairly rare in Canada. The projections for the 3rd quarter GDP number are between 2.5% and 3.0%, annualized.
*Sources: MSCI, FTSE, Morningstar Direct, Trading Economics

